
stdout/stderr as a file widget on a custom dashboard — alongside images, video, and audio — so logs sit next to your metrics and visualizations in a single view.
Adding a log widget
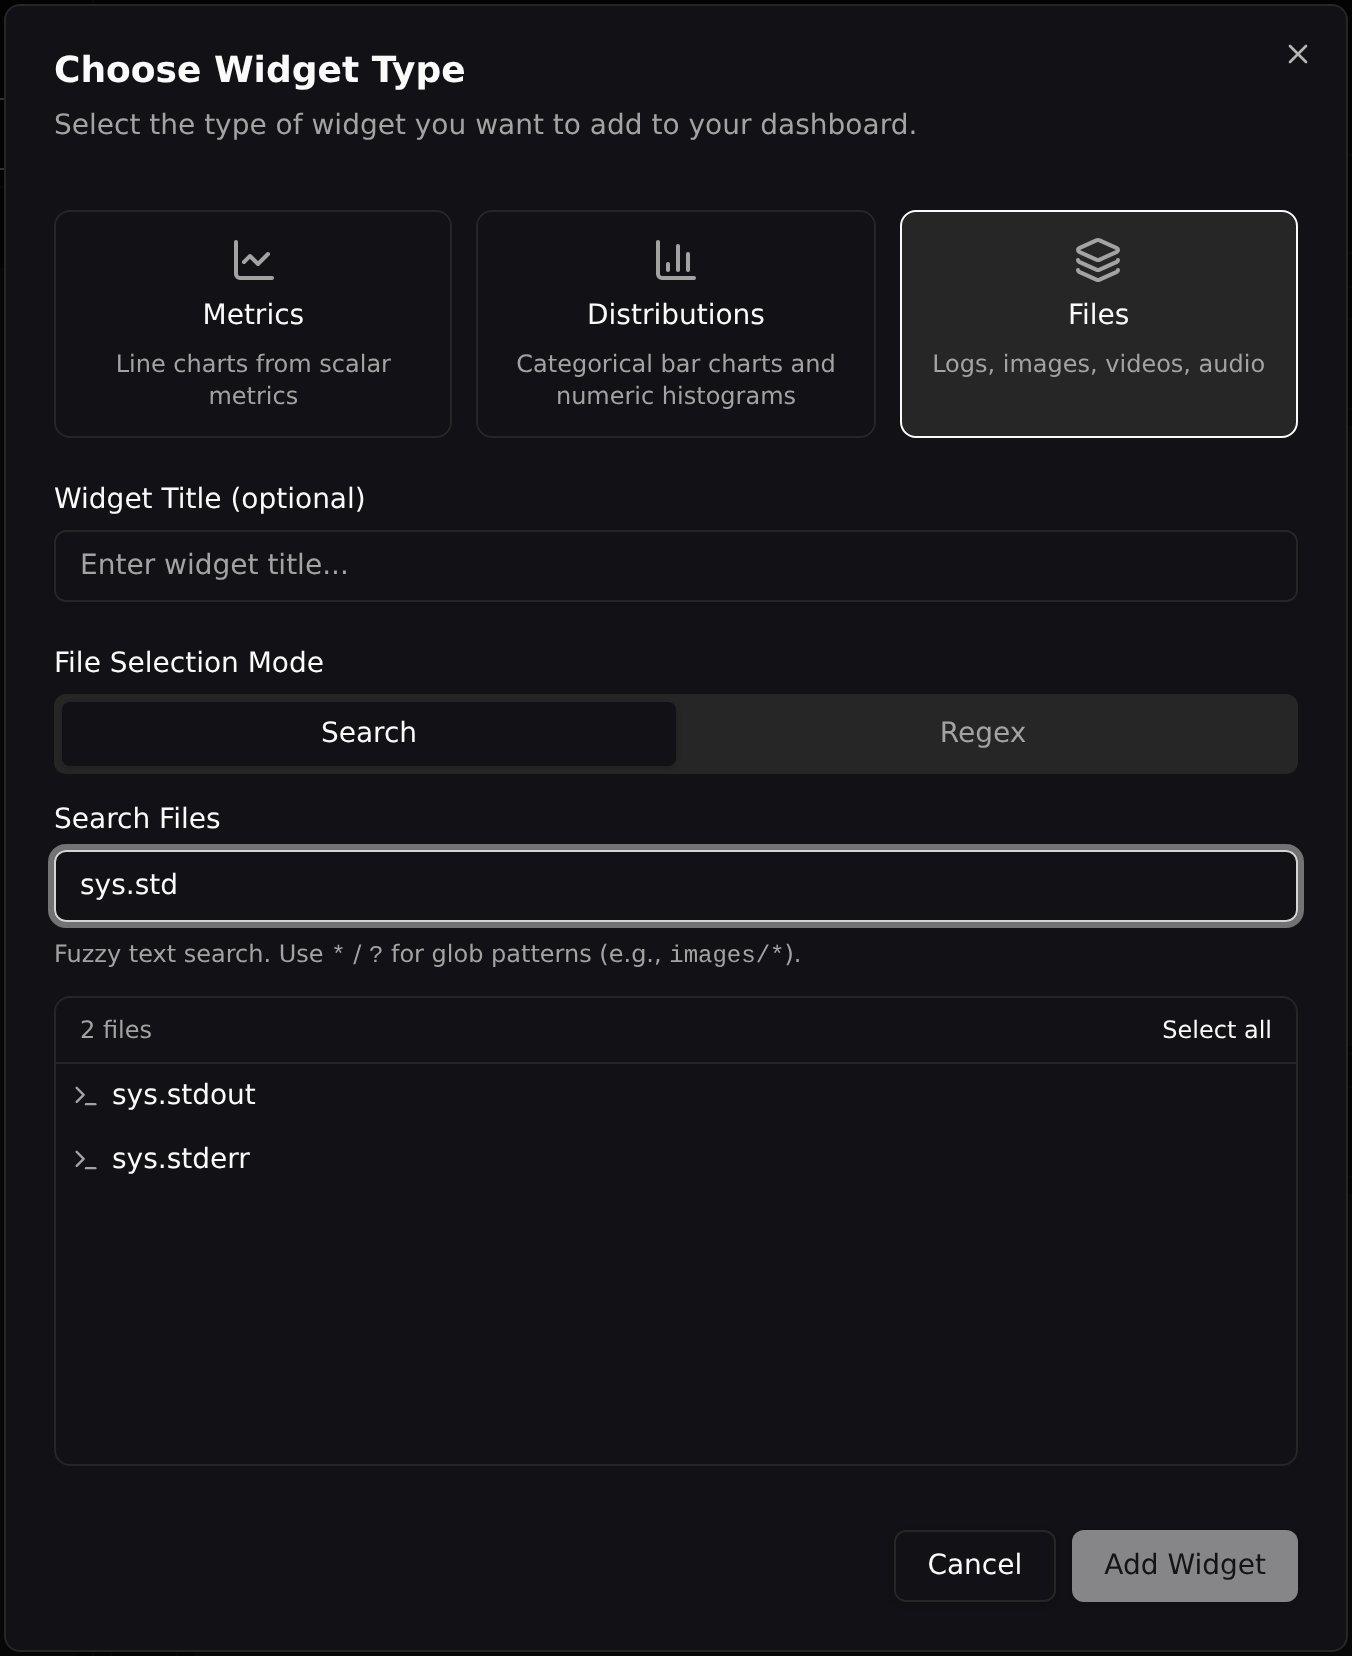
Open Add Widget, choose the Files tab, and search for a console log stream —sys.stdout or sys.stderr.
stdout/stderr inline on the dashboard:
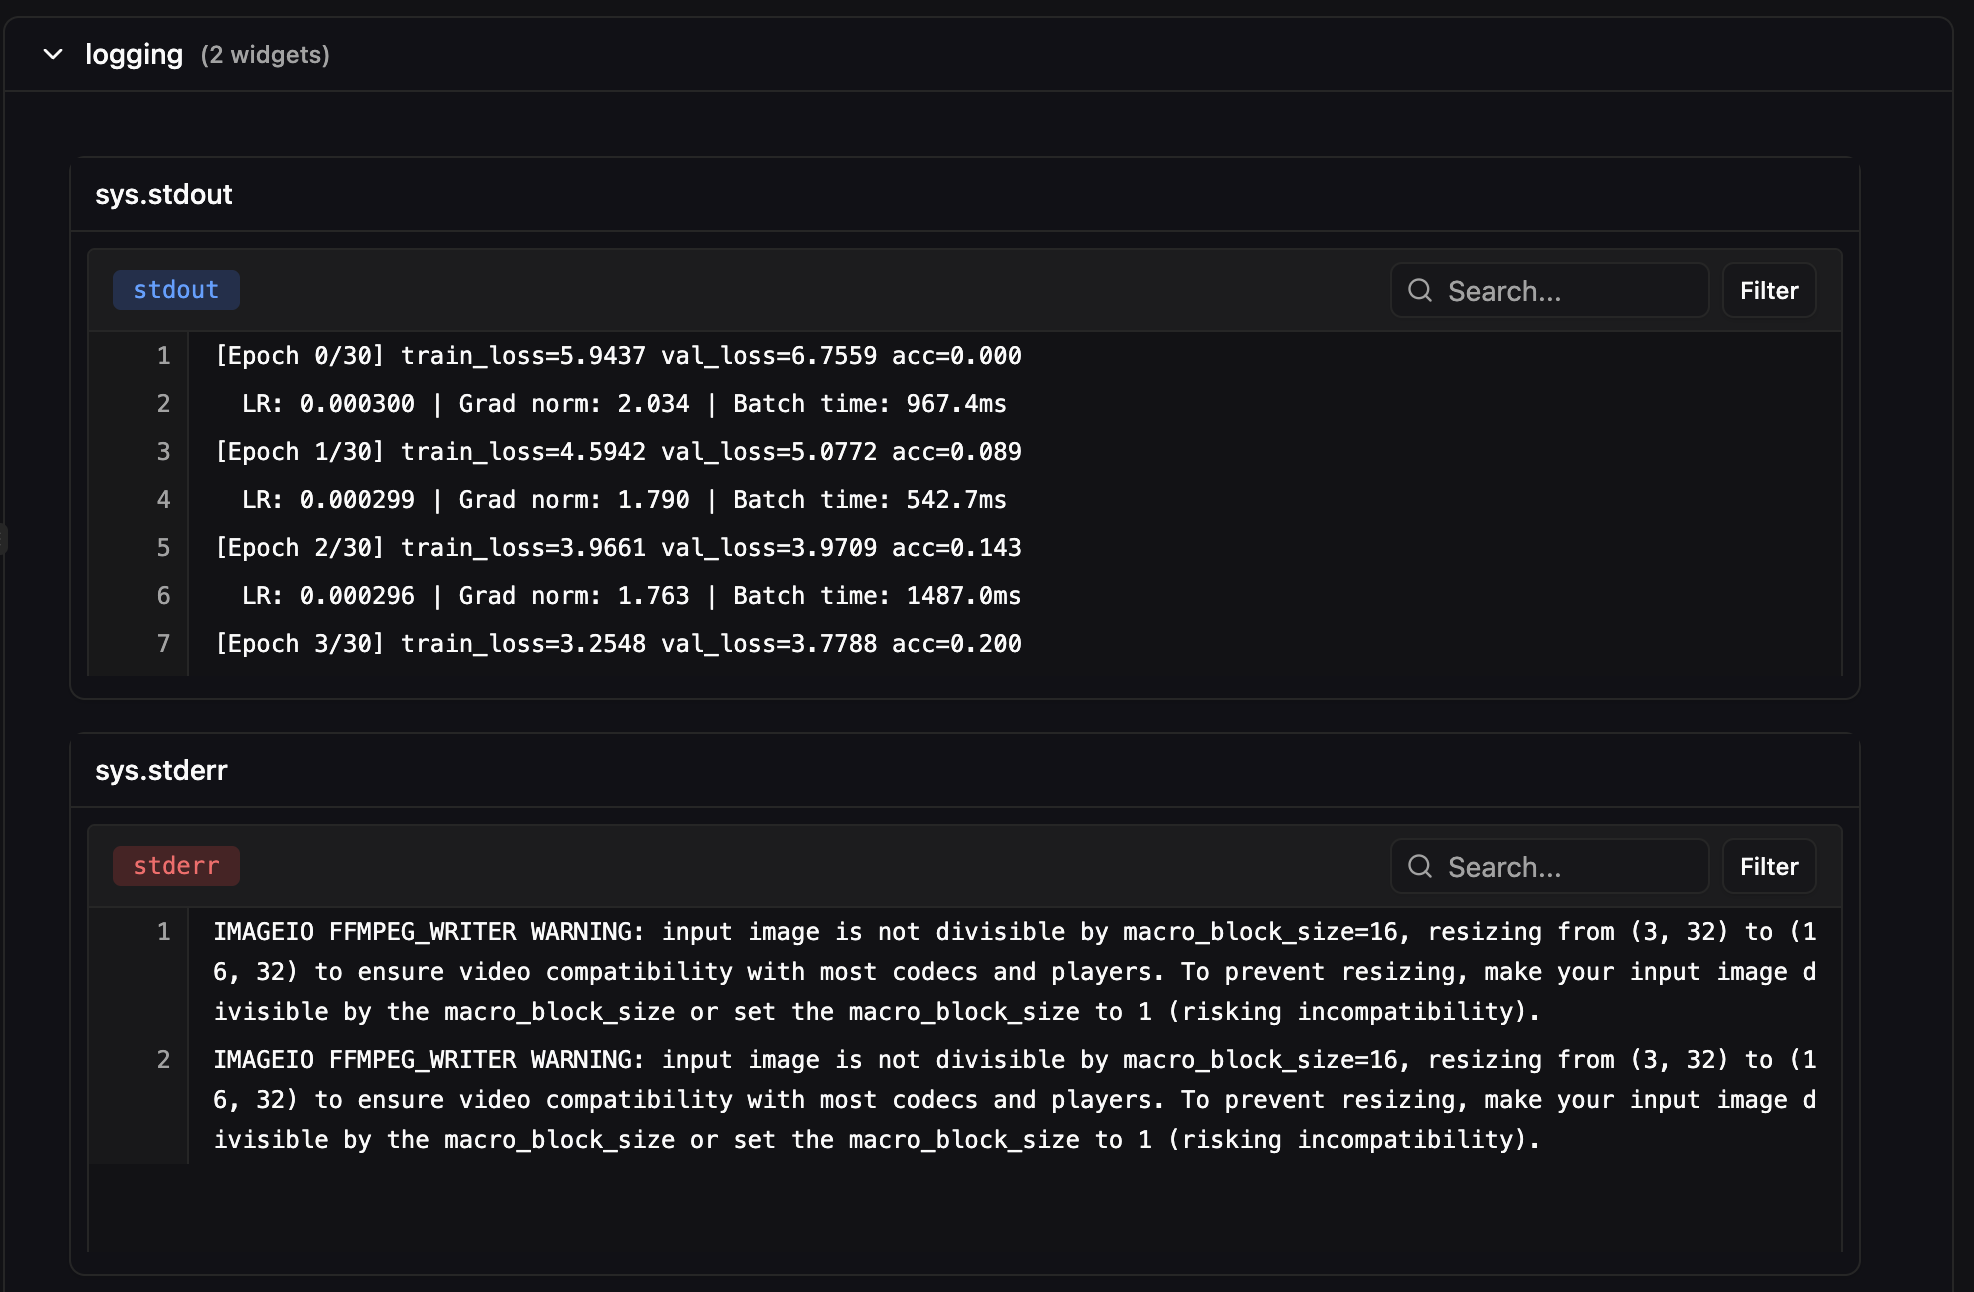
Search and filter
Console log widgets support the same tools as the full Logs viewer:- Filter — show only the log lines matching your query.
- Navigate — highlight matches and jump between them with next/previous while keeping the full log in view.
- ANSI colors — colored output (e.g. from
richorcolorama) renders with its original terminal formatting.
Looking for the full-screen, per-run log viewer instead? See the dedicated Logs page.