
Logging
Audio files can be logged via a file path or a NumPy array containing audio data shaped asframes × channels.
To log audio, instantiate the pluto.Audio class:
Examples
Logging from File Paths
Logging from NumPy Arrays
Viewing
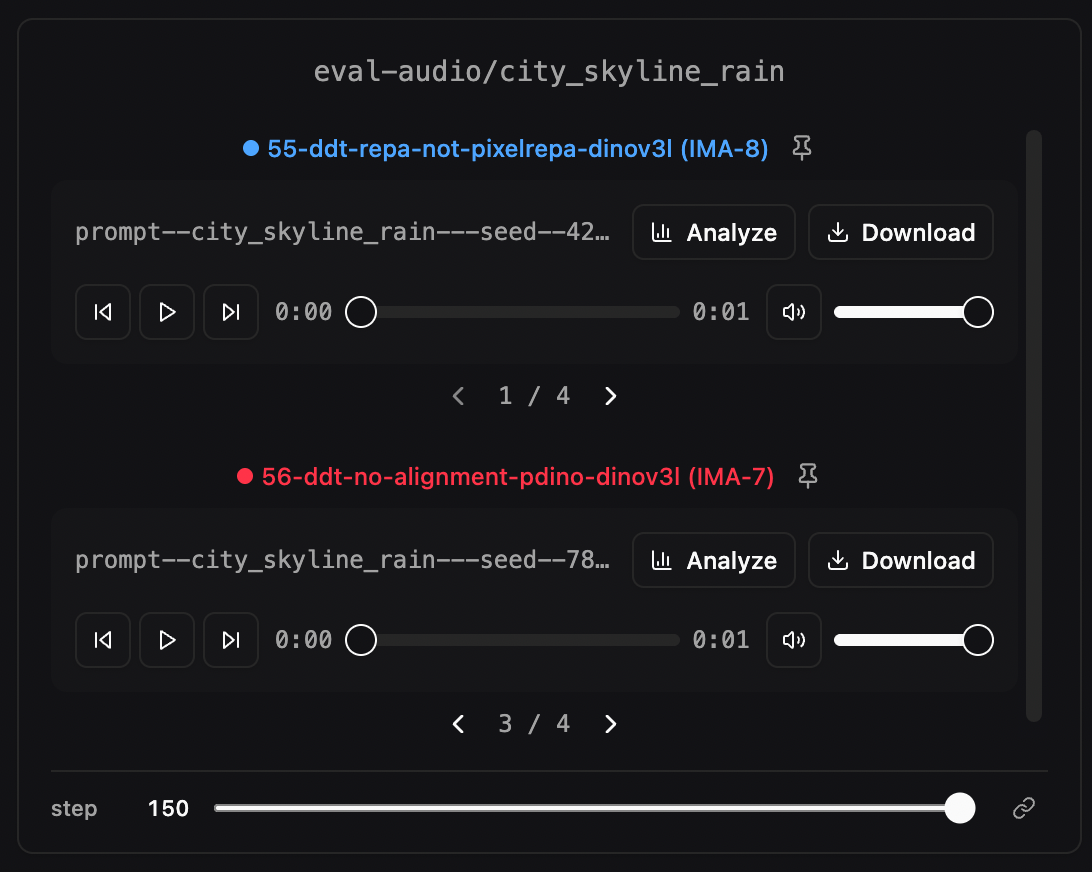
Logged audio files appear as player widgets with playback controls, volume adjustment, and per-file Analyze and Download buttons. When comparing multiple runs, each audio card shows the run name with its assigned color.Comparing multi-sample audio logs across runs.
Adding to a dashboard
Audio players show up automatically in the Compare view. To place them on a custom dashboard, open Add Widget, choose the Files tab, and search for your audio log name.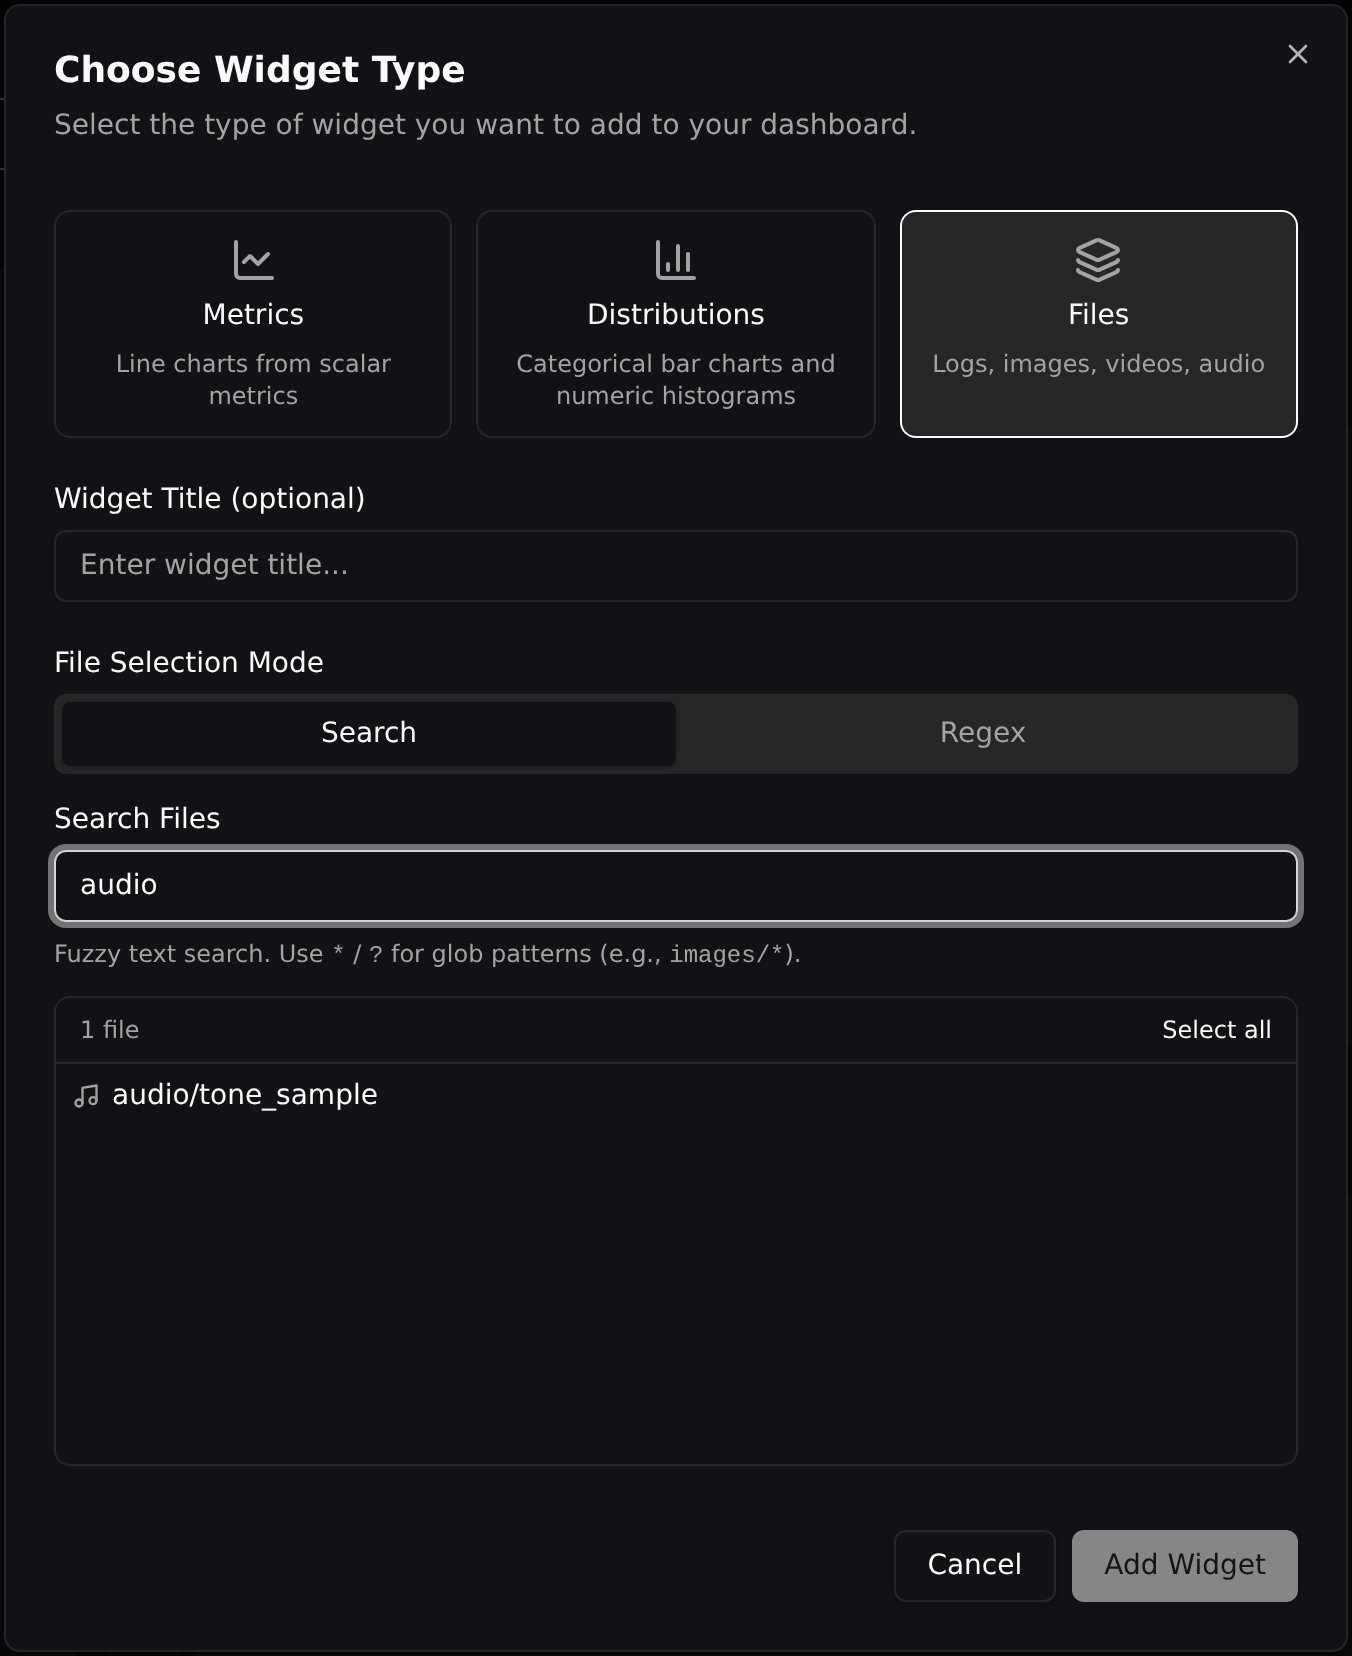
Playback Controls
Each audio player includes:- Play / Pause with a progress slider you can drag to seek
- Skip forward / back buttons (5-second jumps)
- Volume slider with mute toggle
- Download — saves the audio file locally
- Analyze — opens the audio analysis dialog (see below)
Step Navigation
If you log audio at multiple training steps, use the step slider below the players to browse through different steps. This is useful for tracking how generated audio (e.g., text-to-speech) improves over the course of training. When multiple audio groups are displayed in the same section, their step sliders can be linked so that changing the step on one group changes all of them simultaneously. Click the lock icon on the step navigator to toggle sync on or off.Multi-Sample Logging
Log several clips at the same step under one log name by passing a list. Every clip renders inside the same card with a per-cell◀ i / N ▶ nav row below the player:
Sync Sample Indices
A Sync Sample Indices selector in the media settings popover controls how the sample index is shared:- Off — each run steps through its samples independently.
- Across runs — every run in the same widget shares the sample index.
- Across widgets (default) — every run on every media widget (image, video, and audio) advances the sample index in tandem.
Pinning Runs at a Step
The global step slider forces every run to be viewed at the same step, which makes it hard to compare runs at their respective best checkpoints — different runs converge at different steps. Pinning lets you freeze individual runs at a specific step while the global slider keeps driving everything else. Each pinned card shows a colored badge with the pinned step. Click the pin button on an audio card to choose the pin scope: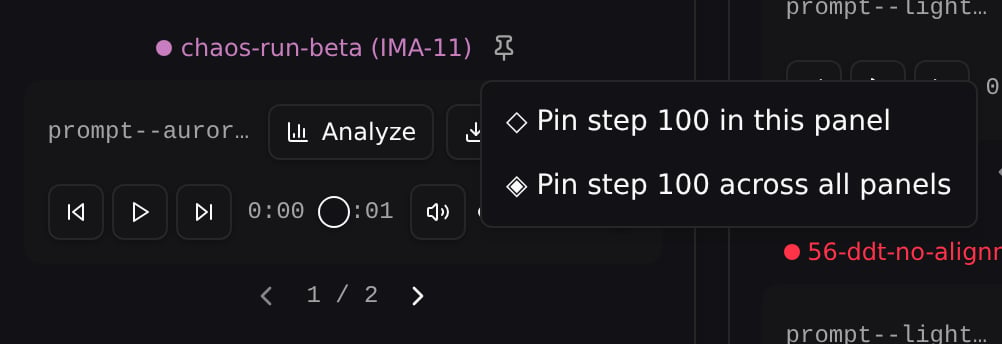
Unpinning
Cross-panel and best-step pins offer two unpin options: Unpin this audio removes the pin from this widget only, while Unpin across all panels removes it everywhere. Local single-panel pins keep the simpler one-click unpin.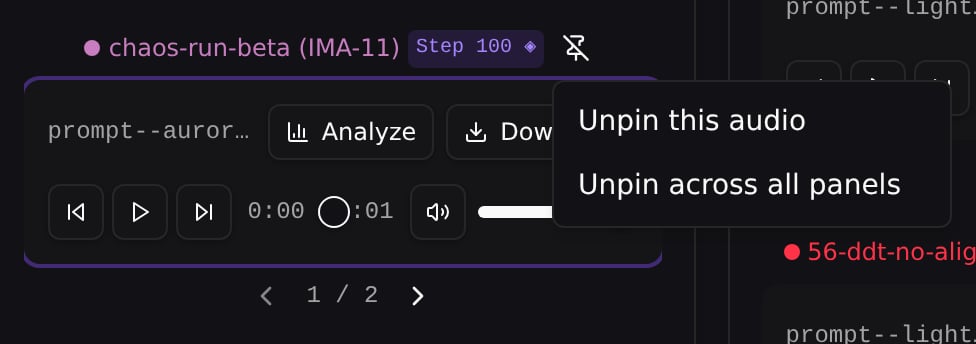
Clear All Pins
Click Clear All Pins to remove every pin (local, cross-panel, and best-step) at once for the current page.Best-Step Pinning
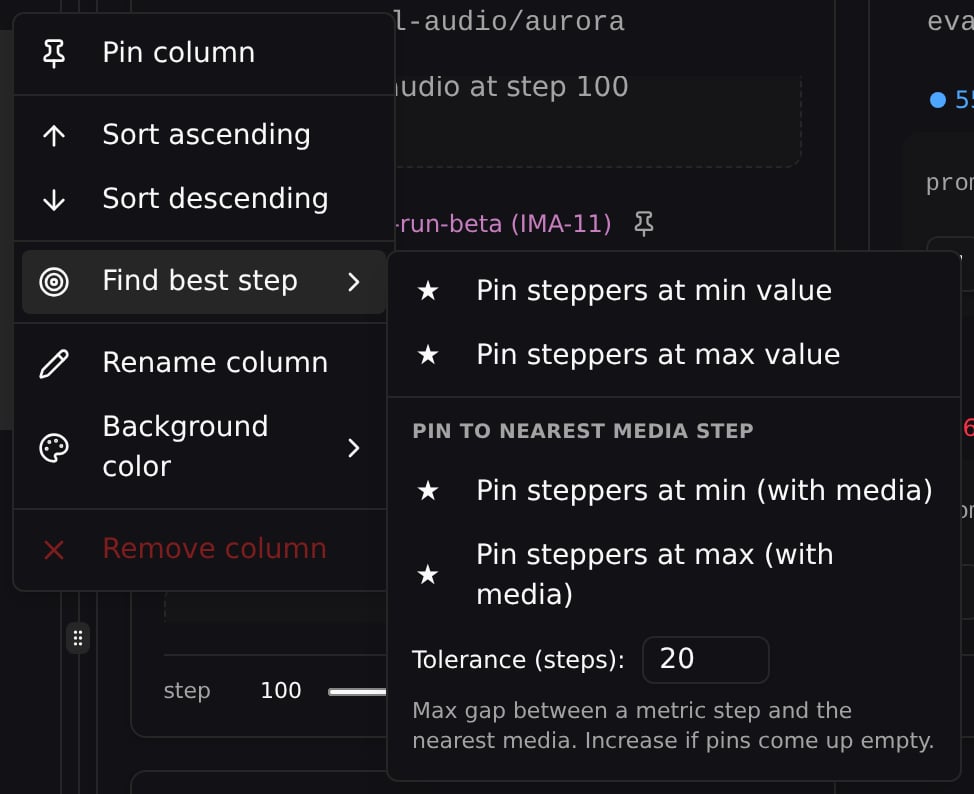
For metric-driven exploration (e.g. “play each run at its best loss”), pin every run on the page to its own argmin/argmax step in one click. Open a metric column’s header menu in the runs table, then choose Find best step → one of:
The (with media) variants (grouped under Pin to nearest media step) are useful when your metric and audio cadences don’t perfectly overlap — without them, the chosen step might land on a step that has no clip, so the card falls back to the No audio at step N placeholder.
Tolerance Window
Even with the (with media) variants, your metric and audio cadences may not align exactly. The best-step picker handles this with a nearest-snap with tolerance: each metric step snaps to its closest clip step within a step-distance limitK (default K = 20).
You can edit K directly in the Find best step submenu — type a value, press Enter or click any of the four pin buttons.
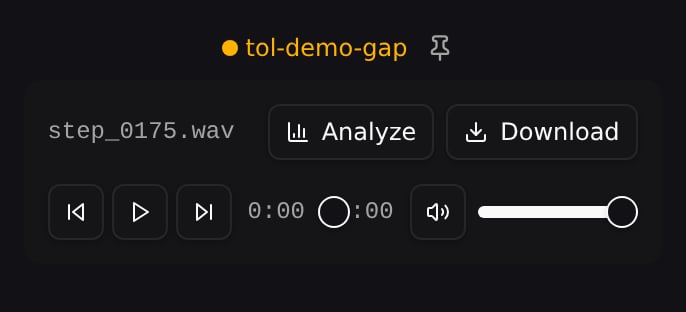
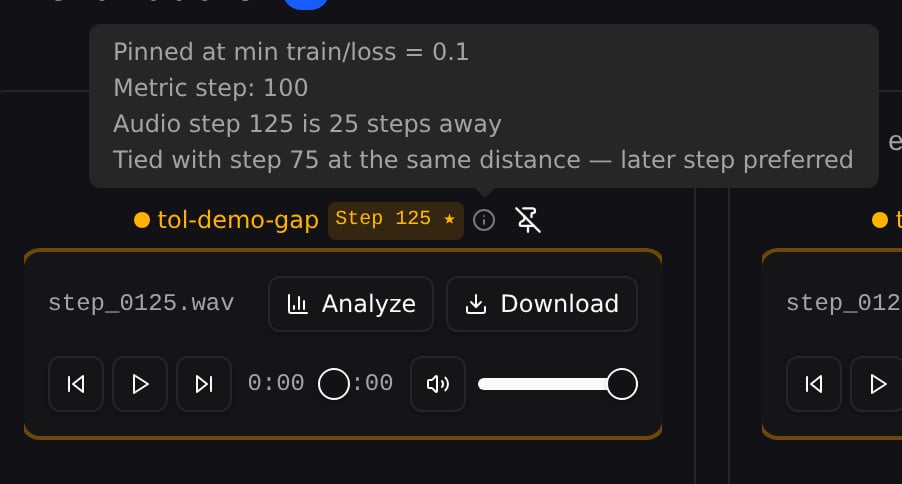
Widen the window if pins come up empty. In the tol-demo-gap run below, the metric is logged at steps 0/50/100/150/200 and clips only at 25/75/125/175, so every metric step sits exactly 25 steps from the nearest clip. At the default K = 20 nothing is within tolerance and the run stays unpinned (plain pin icon, no step badge); raise K to 25 and the min-loss step (100) snaps to audio step 125 — the provenance even notes the tie with step 75, broken toward the later step.
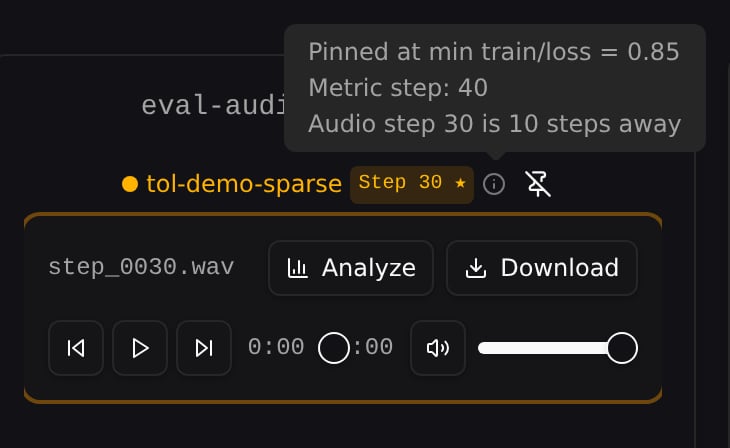
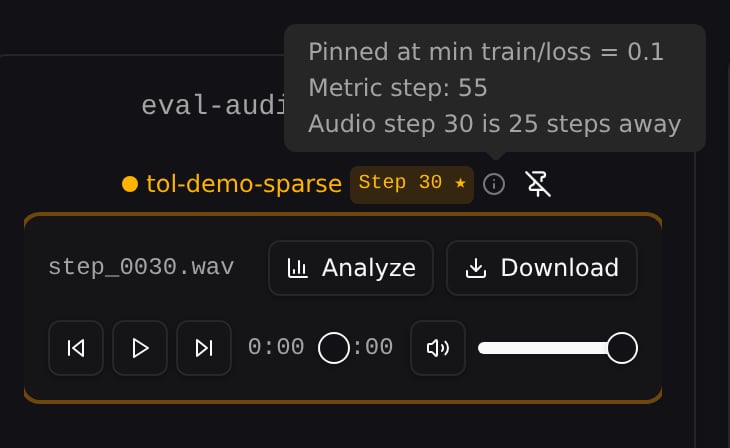
tol-demo-sparse below, K = 10 only reaches metric step 40 (loss 0.85), while K = 25 reaches metric step 55 — the true minimum (loss 0.1). The pinned clip is the same in both (step 30); only the provenance popover reveals which metric step drove the pick.
Pin Provenance
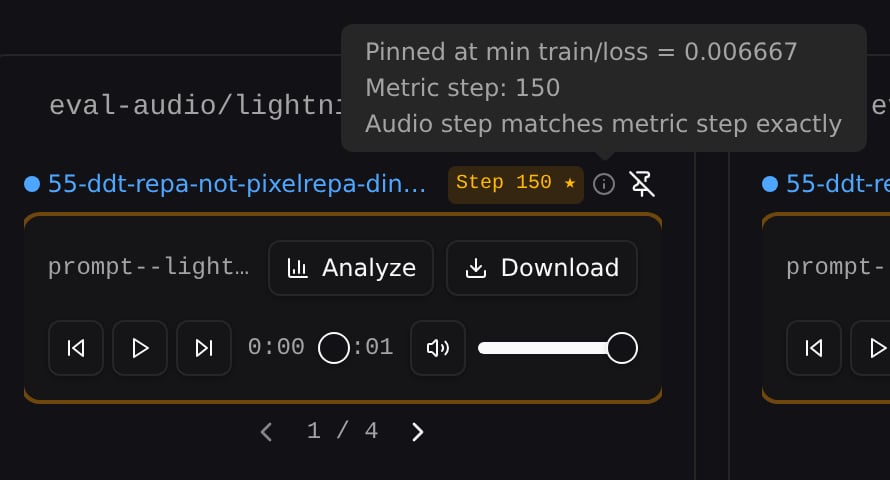
Every best-step pinned card shows an info icon (ⓘ) next to the run name. Hover for a popover that explains why this step was chosen:- A headline with the metric and extreme that drove the pick (e.g. Pinned at min train/loss = 0.006667)
- The metric step that drove the pick
- How far the chosen clip is from that metric step (or that it matches exactly)
Audio Analysis
Click Analyze on any audio player to open a dialog with three tabs:- Spectrum — Real-time frequency spectrum visualization that animates during playback
- Waveform — Time-domain waveform drawn from the audio buffer
- Statistics — Peak amplitude, RMS level, duration, sample rate, number of channels, and dynamic range