
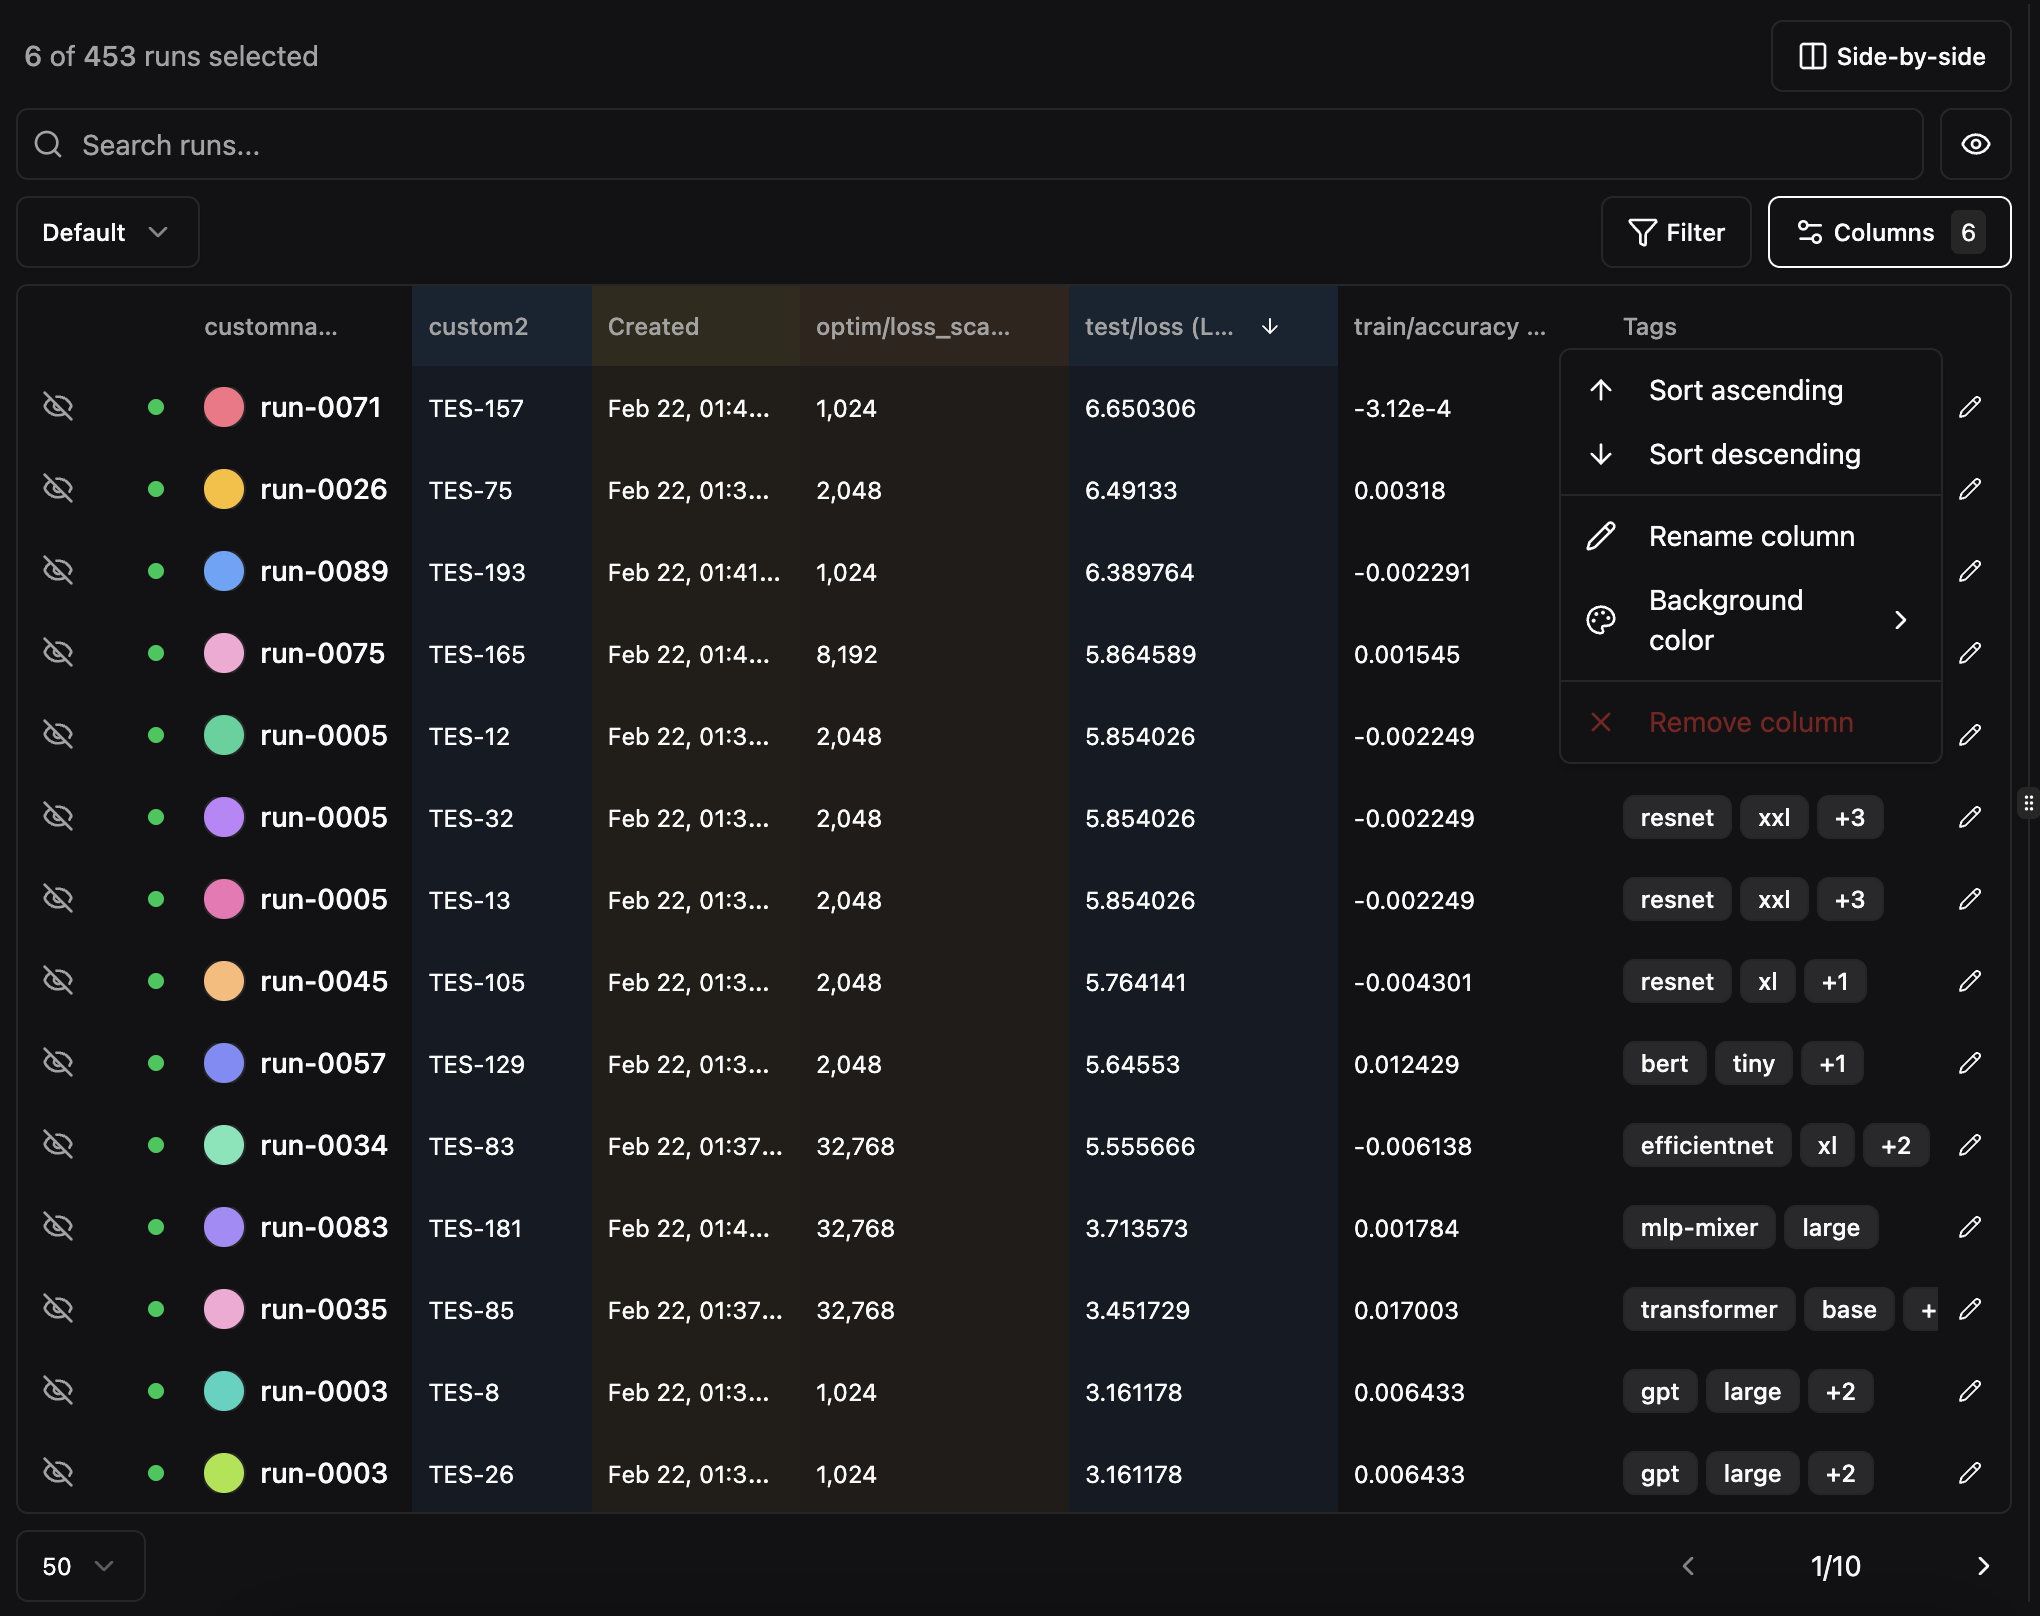
Column Header Menus
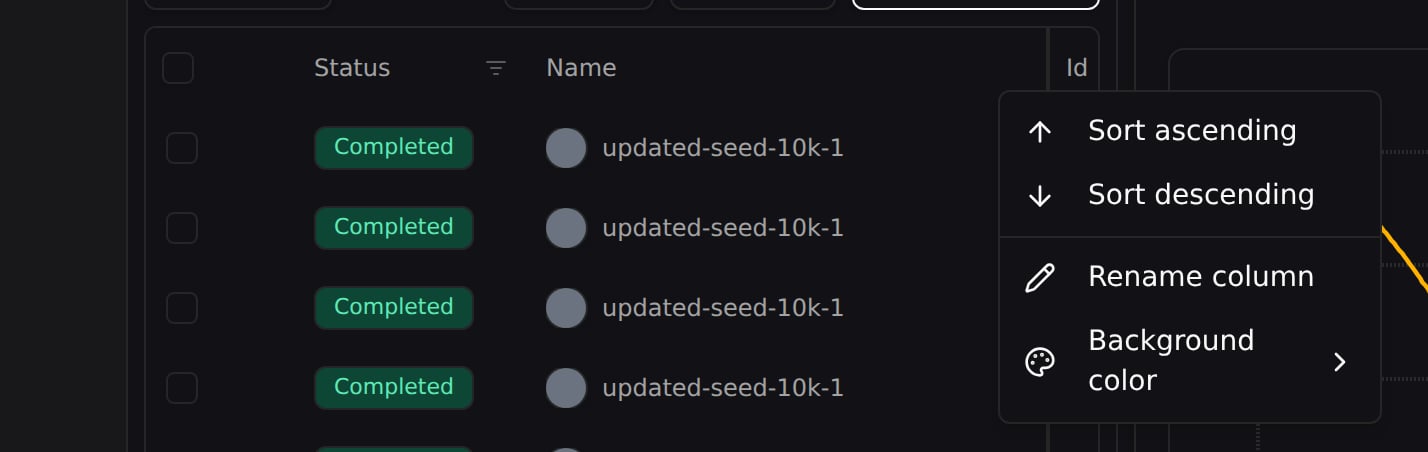
Right-click or click the menu icon on any column header to access options:- Sort ascending or descending
- Rename the column display name
- Set column color for visual grouping
- Pin column to the left or right side of the table to keep it visible during horizontal scrolling. The Select, Status, and Name columns are pinned by default.
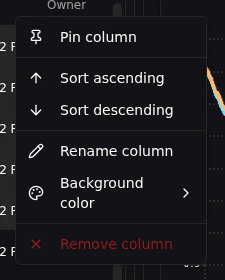
Column Picker
Click the Columns button to choose which columns are visible in the runs table. The default columns are Status, Name, Id, Created, Duration, Owner, Tags, and Notes, but you can add or remove any column.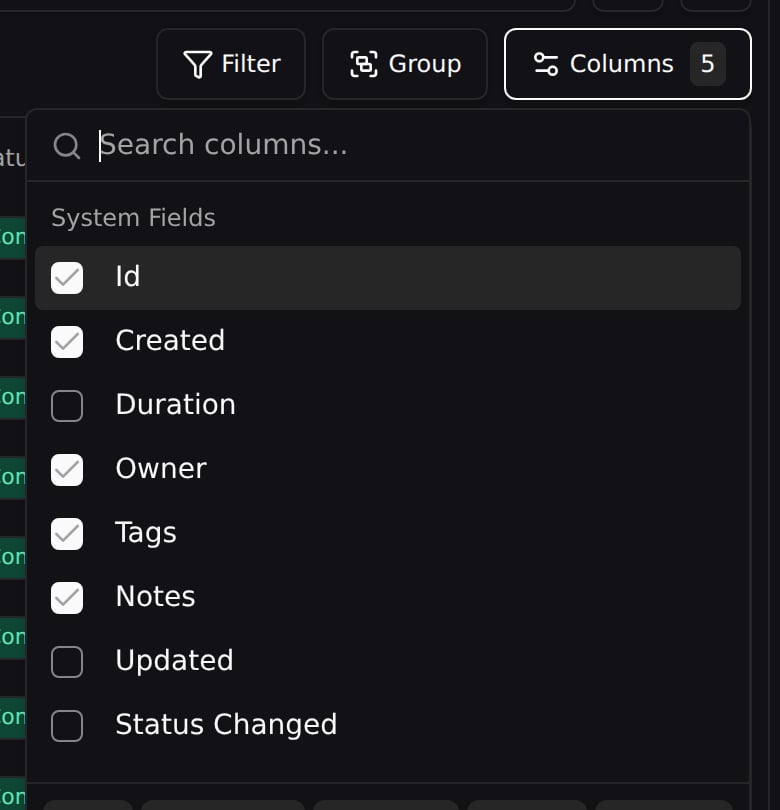
Grouping Runs
Group the runs table into a bucket tree by any field the runs already carry.Grouping runs is currently in alpha. Please send any feedback to founders@trainy.ai
Grouping by a field
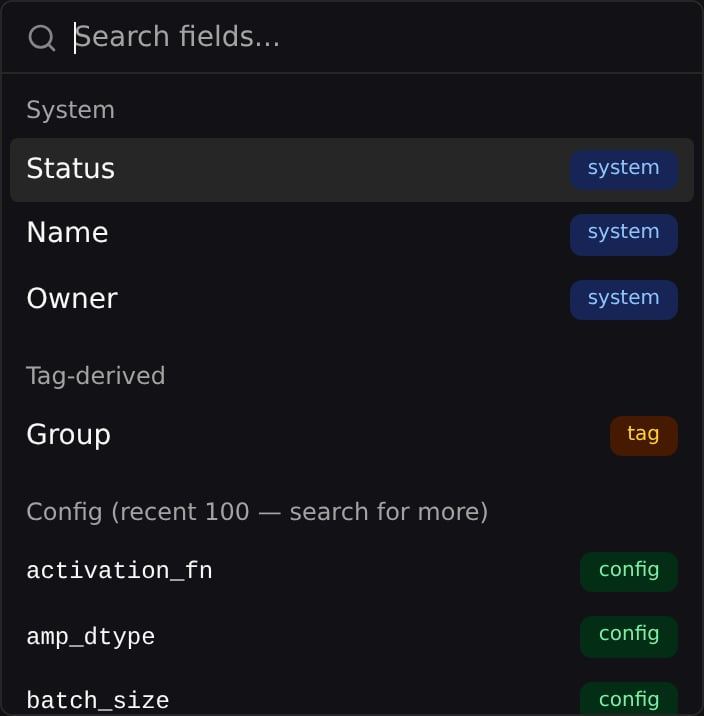
Click the Group button in the toolbar (between Filter and Columns) to open the Group runs by picker, then add a field. You can group by:- System — a run’s
Status,Name, orOwner. - Tag-derived — the
Groupfield, which buckets runs by the value of theirgroup:tag. A run taggedgroup:resnet-sweeplands in theGroup: resnet-sweepbucket. - Config — any value from a run’s logged config (e.g.
batch_size,optimizer). The picker lists the 100 most recent config keys; type in the search box to reach others. - System metadata — any value from a run’s system metadata (e.g.
gpu_count), also searchable beyond the recent 100.
Multi-level grouping
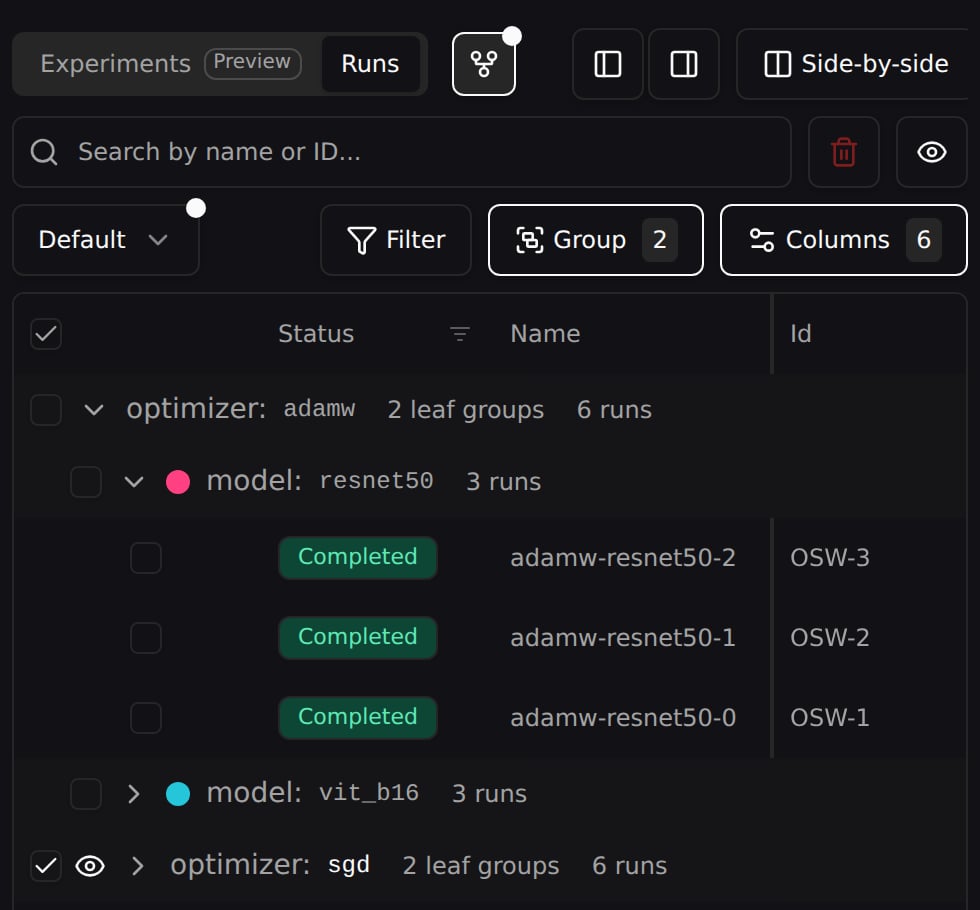
Grouping is a stack of fields. Click Add grouping field to add another level (up to 5). The first field is the outermost bucket and each subsequent field nests inside it. Reorder levels with the up/down arrows on a chip, swap a level’s field by clicking it, or remove a level with its ✕.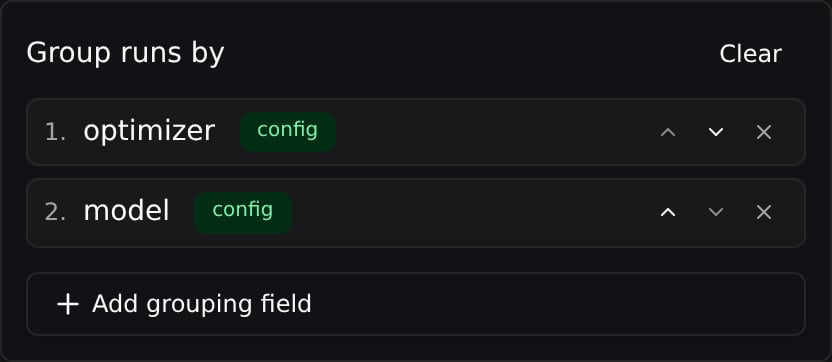
Run Visibility
Select a run — check its box in the leftmost column — to plot it on the charts. The selected set is also what bulk actions like delete operate on. You can select up to 100 runs at once.- The header checkbox selects or clears every run on the current page.
- Shift-click a checkbox to select the whole range between it and the last box you clicked.
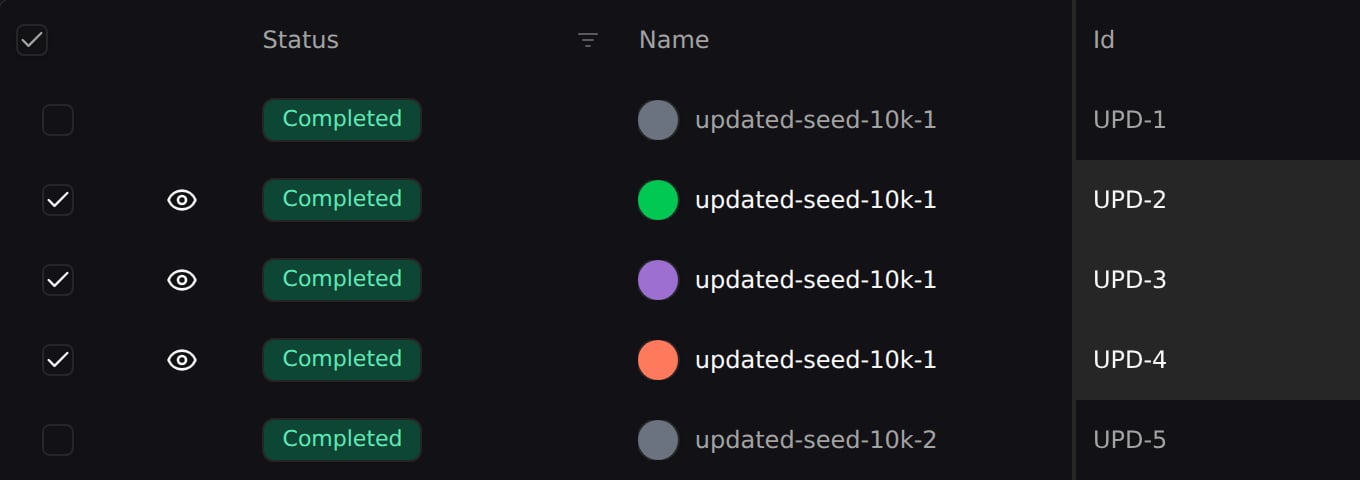
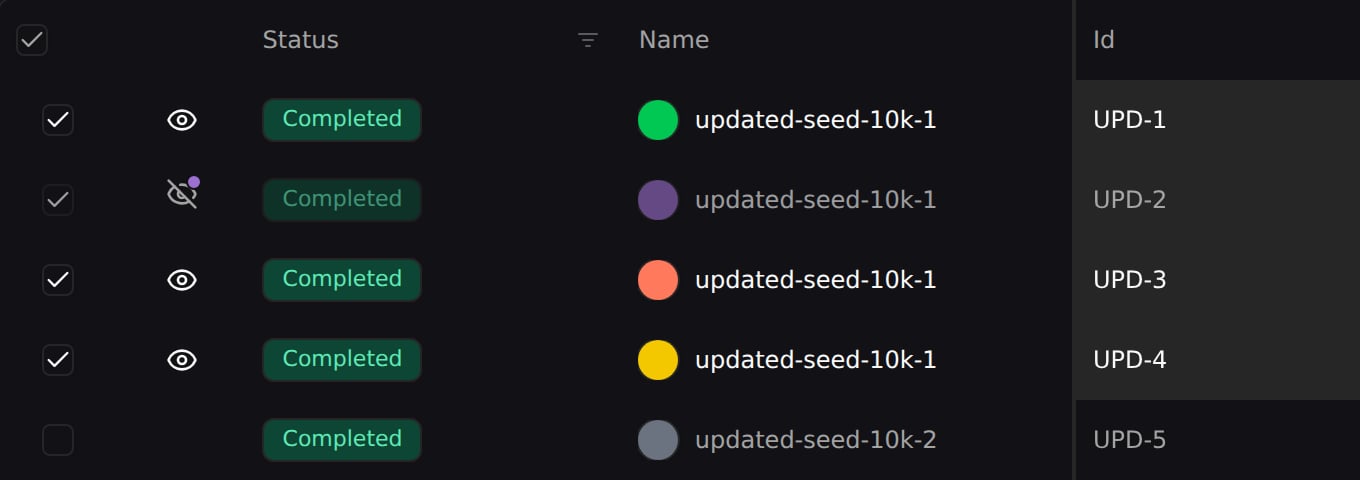
- Hide from charts — click the eye on a visible run to mute it on the charts while keeping it selected. Useful when a noisy run is obscuring the trends you’re comparing.
- Show on charts — click the eye-off icon on a hidden run to draw it again.
?runs= and hidden runs as ?hidden=, so links are shareable.
To manage the whole selection at once, use the Visibility options dropdown above the table:
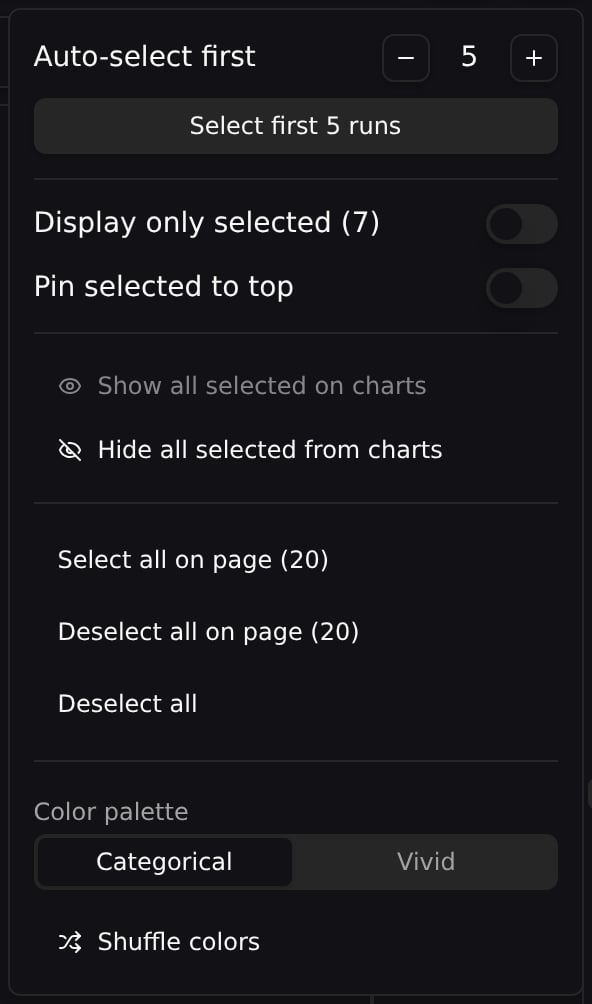
- Show all selected on charts / Hide all selected from charts — mute or restore every selected run at once.
- Display only selected — hide unselected runs from the table.
- Pin selected to top — float the selected runs above the rest.
- Auto-select first N — select the top N runs in one click.
- Deselect all, plus color palette and shuffle colors controls.
Deleting Runs
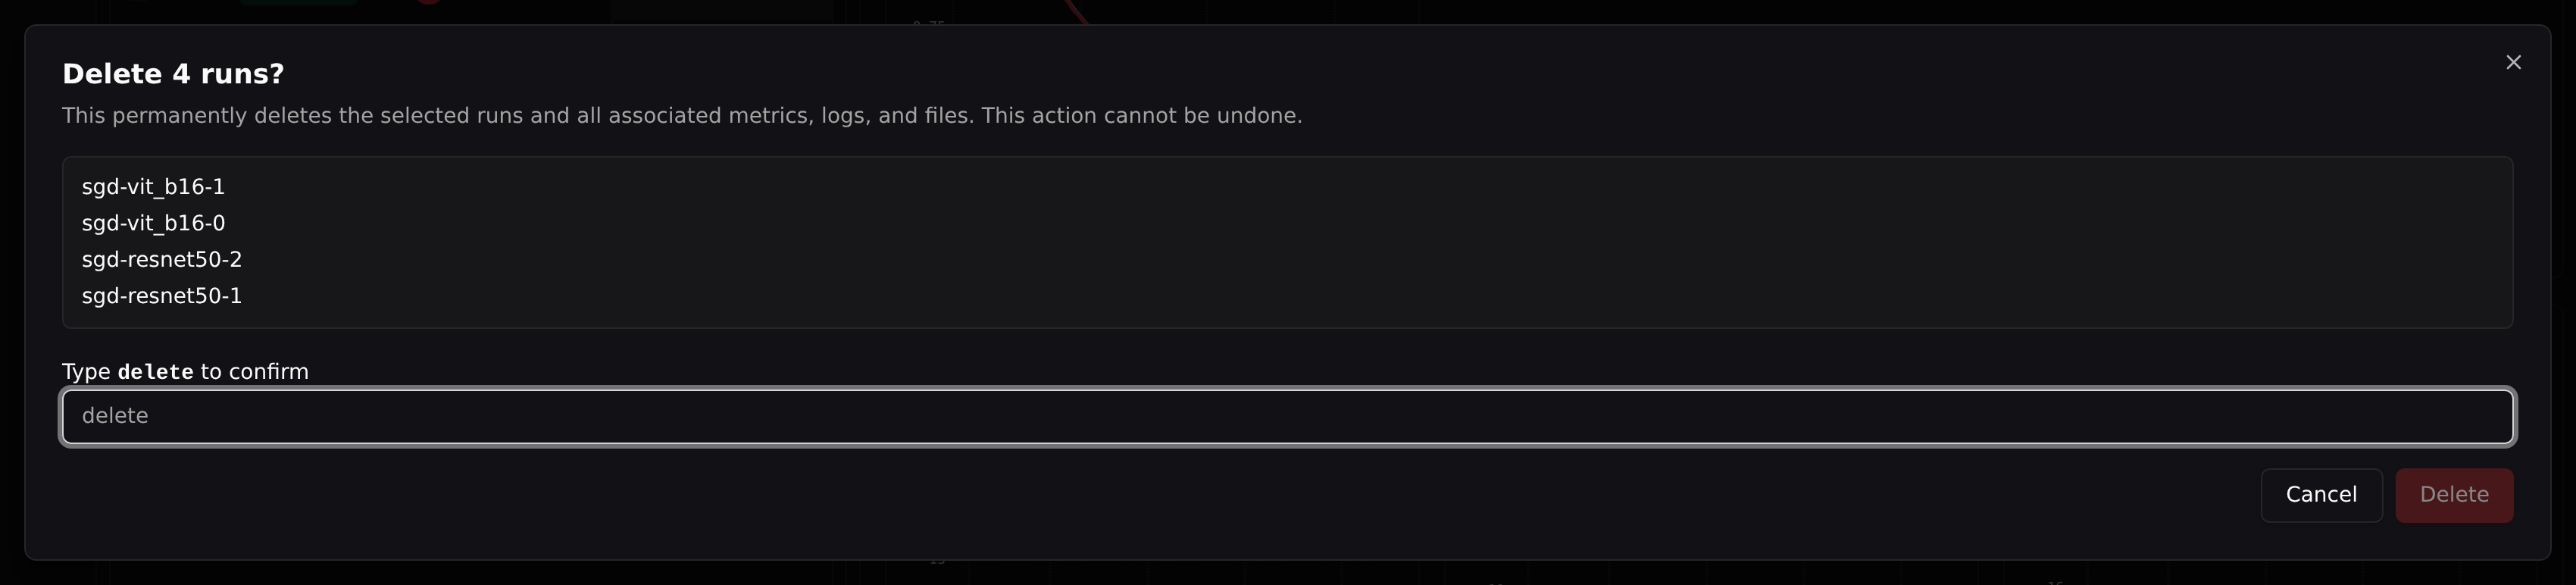
To prune failed or junk runs, select them and click the trash icon next to the search box. It stays disabled until at least one run is checked, and its tooltip tells you how many will go. Deletion is permanent: it removes the runs along with all of their metrics, logs, and files, and it cannot be undone. Pluto previews the runs you’re about to remove and asks you to typedelete to confirm. Once deleted, the runs are dropped from your selection and disappear from the charts.
Deleting a whole project
To remove an entire project rather than individual runs, go to the projects list, hover the project’s row, and click its trash icon. Deleting a project is owner/admin only and wipes every run in it — including runs created by other members — along with all their metrics, logs, files, and saved dashboards. As with runs, it’s permanent and asks you to type the project’s name to confirm.Filtering and Sorting
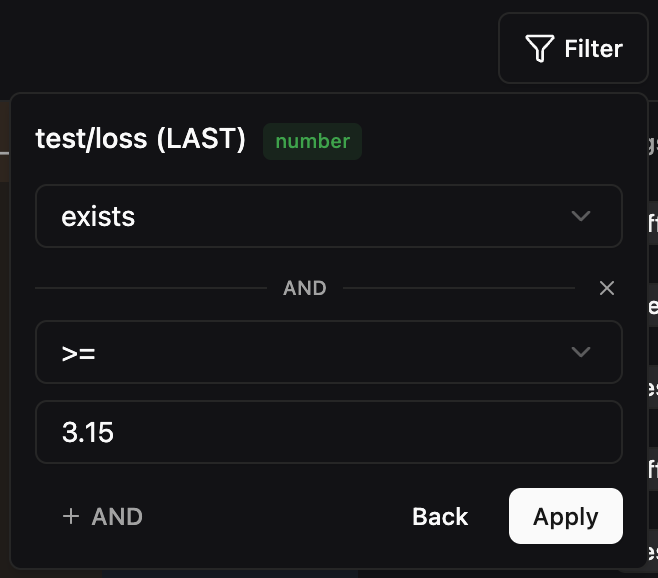
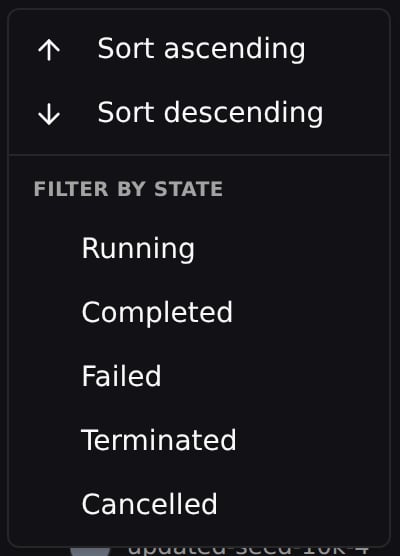
Click the Filter button to open the filter dropdown. The filter system is type-aware, offering different operators depending on the column type.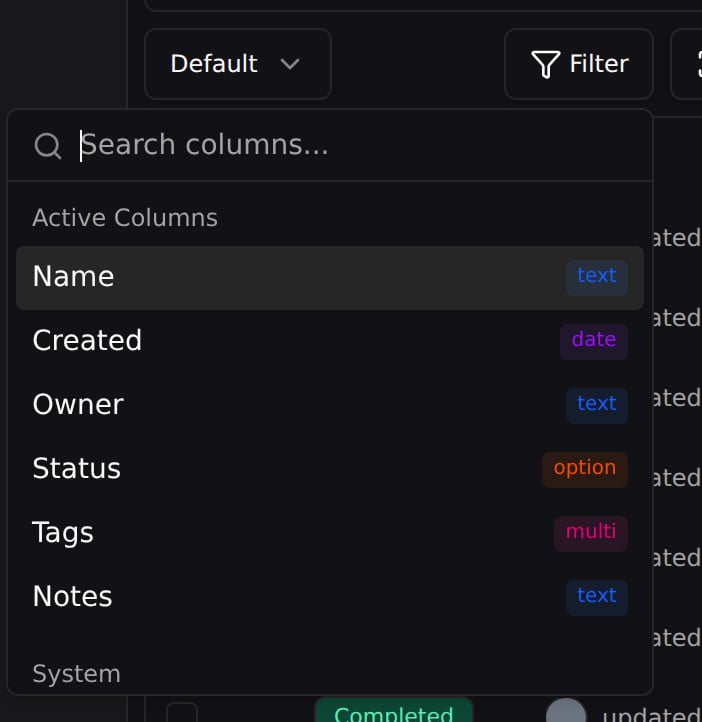
Searching Runs
The Search by name or ID box above the table works in two ways, depending on whether your view is constrained.Plain search
When nothing is hiding runs — no filter, and the whole table is on show — typing simply narrows the list to the rows that match your query.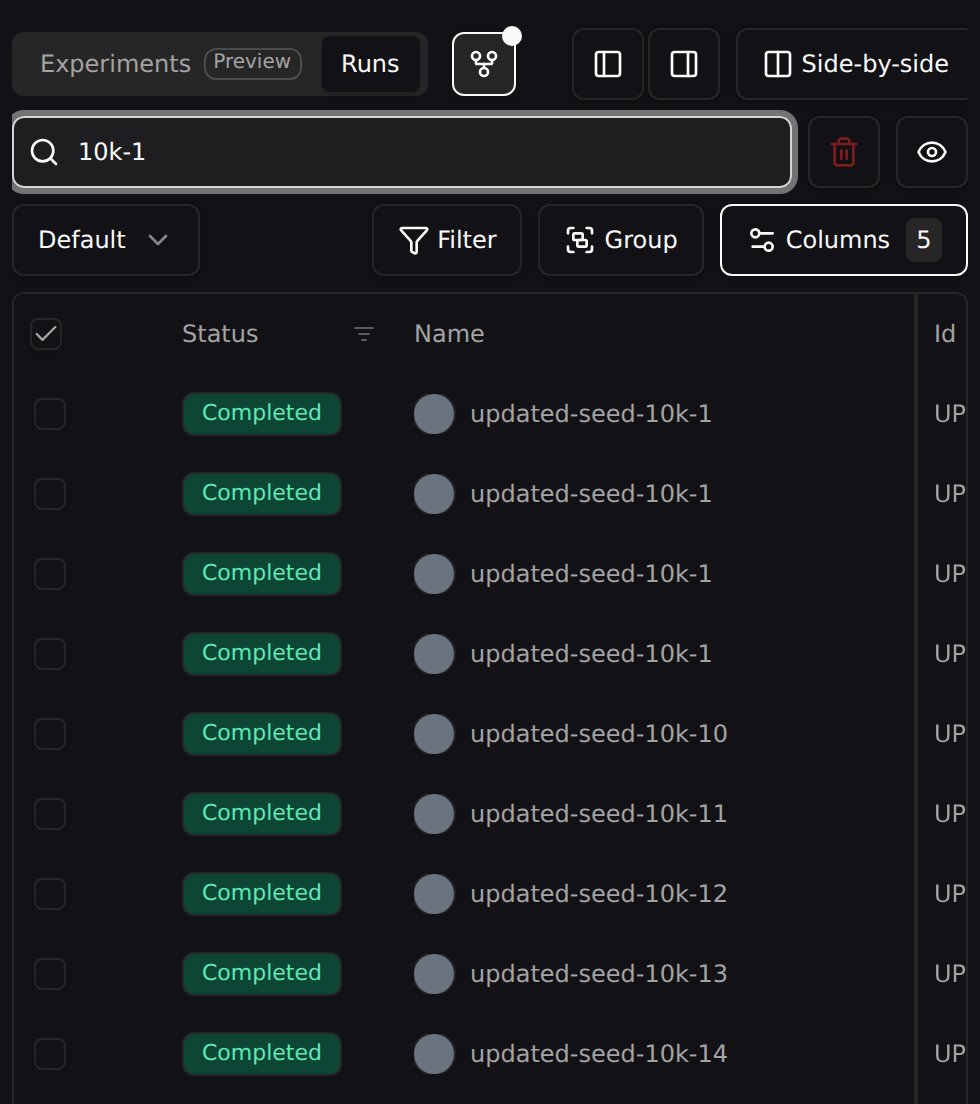
Finding runs outside the current view
The moment your view is constrained, a plain narrow-down would silently miss any match your own view is hiding. So when the table is constrained by any of:- an active filter
- Display only selected
- Pin selected to top
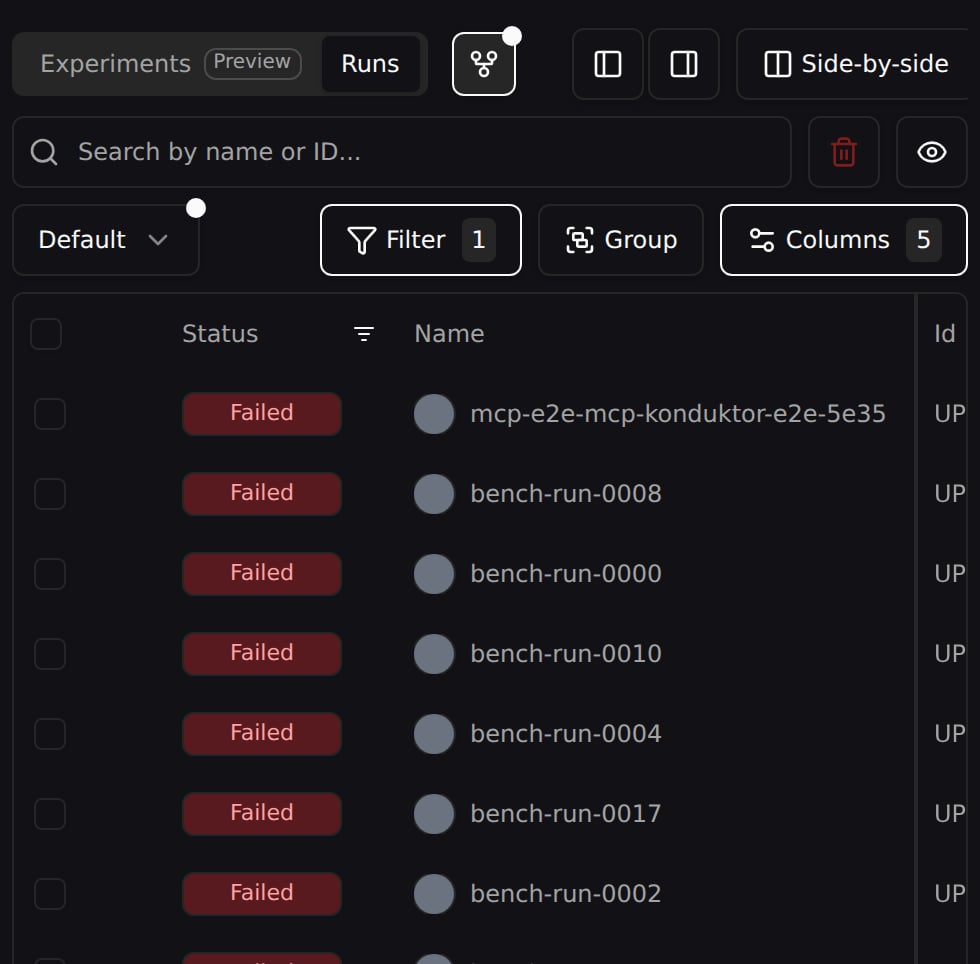
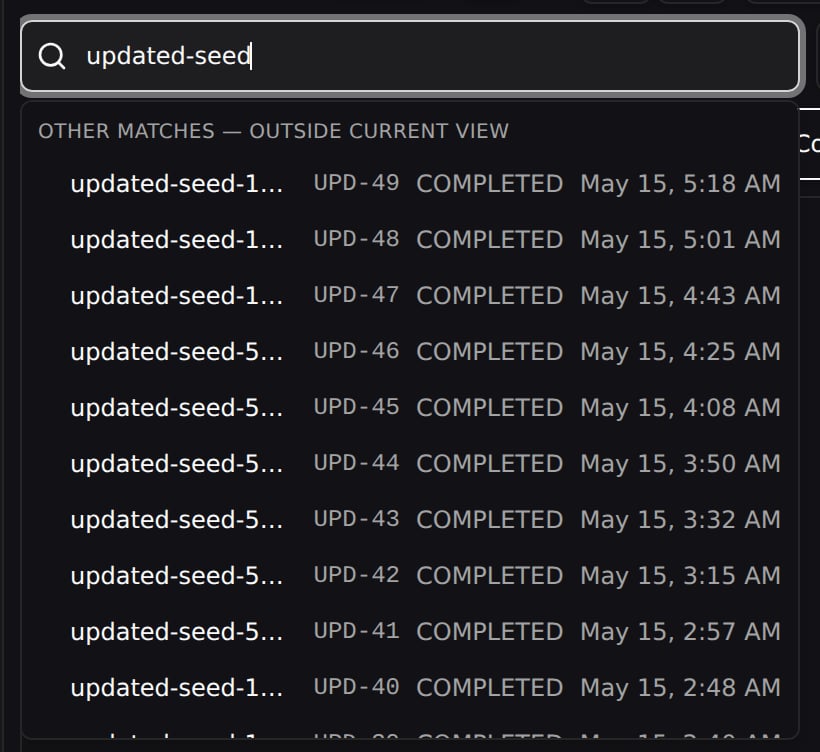
UPD-57), status, and creation time.
- Click an out-of-view run to add it to your selection. The dropdown stays open and keeps your query, so you can pick several in a row.
- A run that’s already showing in the table appears grayed with an In table badge. If it’s currently selected, though, it stays clickable — click it again to deselect it.
- Press Esc or click outside to dismiss the dropdown. Your typed query is kept, so clicking back into the search box brings the results straight back.
Preset Views
Save your table configuration (visible columns, column order, filters, and sort settings) as a named preset view. This is useful for creating reusable perspectives on your data, such as “Training Metrics Only” or “Best Runs”.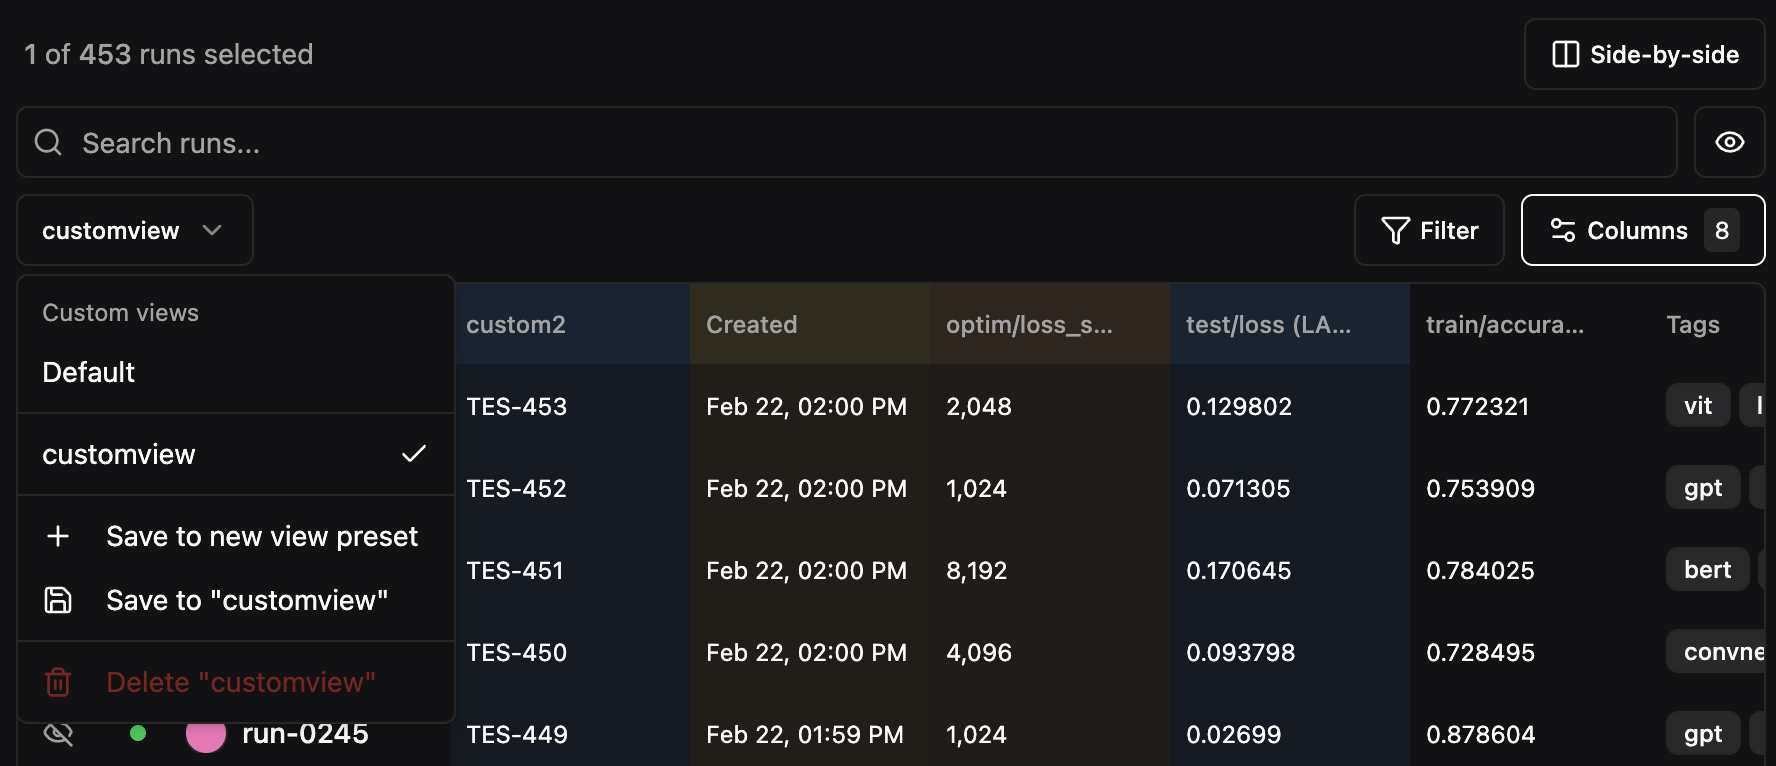
- Configure the table with the columns, filters, and sort order you want
- Click the view selector dropdown (shows “Default” by default)
- Select Save to new view preset
- Enter a name for the preset
Pagination
The runs table paginates when there are more runs than fit on a single page. Use the page size dropdown to choose how many runs to display per page (default: 20). The page indicator (e.g.,1 / 9) is an editable input — click on the current page number and type a page number directly to jump to any page without clicking through next/previous.