Export
Copy to Clipboard
Copy the current chart as an image directly to your clipboard for pasting into documents, Slack messages, or presentations.Download as PNG
Download a high-resolution PNG of the chart to your local machine.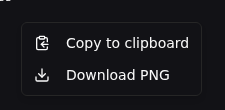
Axis Configuration
Custom X-Axis Metric
By default, charts use the step number as the X-axis. You can select any logged metric as the X-axis instead using the searchable combobox in the chart settings. This is available in both the line settings drawer and the dashboard widget configuration.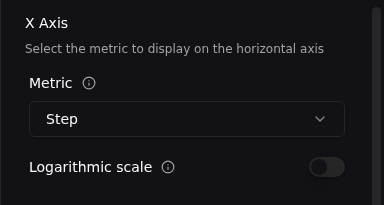
Y-Axis Manual Bounds
Set explicit min and max values for the Y-axis via number inputs in the chart bounds popover. Validation ensures the minimum value is less than the maximum.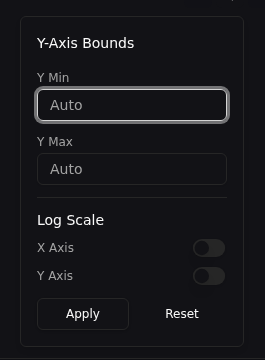
Per-Chart Log Scale
Toggle logarithmic scaling independently for the X and Y axes on each chart. Per-chart log scale settings override the global log scale toggle from line settings.
Line Display
Line Width
Adjust the line width using a slider that ranges from 0.5px to 5px (default: 1.5px). This setting is persisted globally across all charts.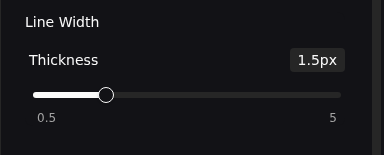
Skip Missing Values
Toggle this option to skip gaps in data instead of interpolating between them. When enabled, the chart will not draw lines connecting data points across missing values, preventing misleading visual connections across data gaps.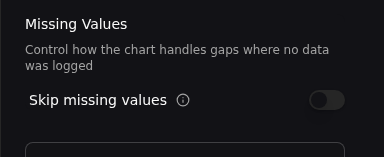
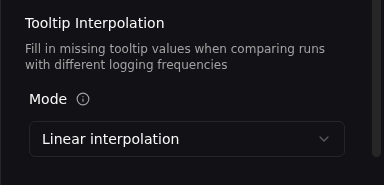
Tooltip Behavior
Interpolation Modes
Control how tooltip values are computed when the cursor is between data points:- None — Only shows values at exact data points. No value is displayed if the cursor is not on a recorded step.
- Linear — Interpolates linearly between neighboring data points to estimate a value at the cursor position.
- Last known — Shows the most recent recorded value before the cursor position.