> ## Documentation Index
> Fetch the complete documentation index at: https://docs.trainy.ai/llms.txt
> Use this file to discover all available pages before exploring further.
# Logs
> Add console log (stdout/stderr) widgets to your dashboards.
Console logs are captured automatically from every tracked run. Besides the full-screen [Logs viewer](/pluto/logs), you can surface a run's `stdout`/`stderr` as a **file** widget on a [custom dashboard](/pluto/dashboards) — alongside images, video, and audio — so logs sit next to your metrics and visualizations in a single view.
## Adding a log widget
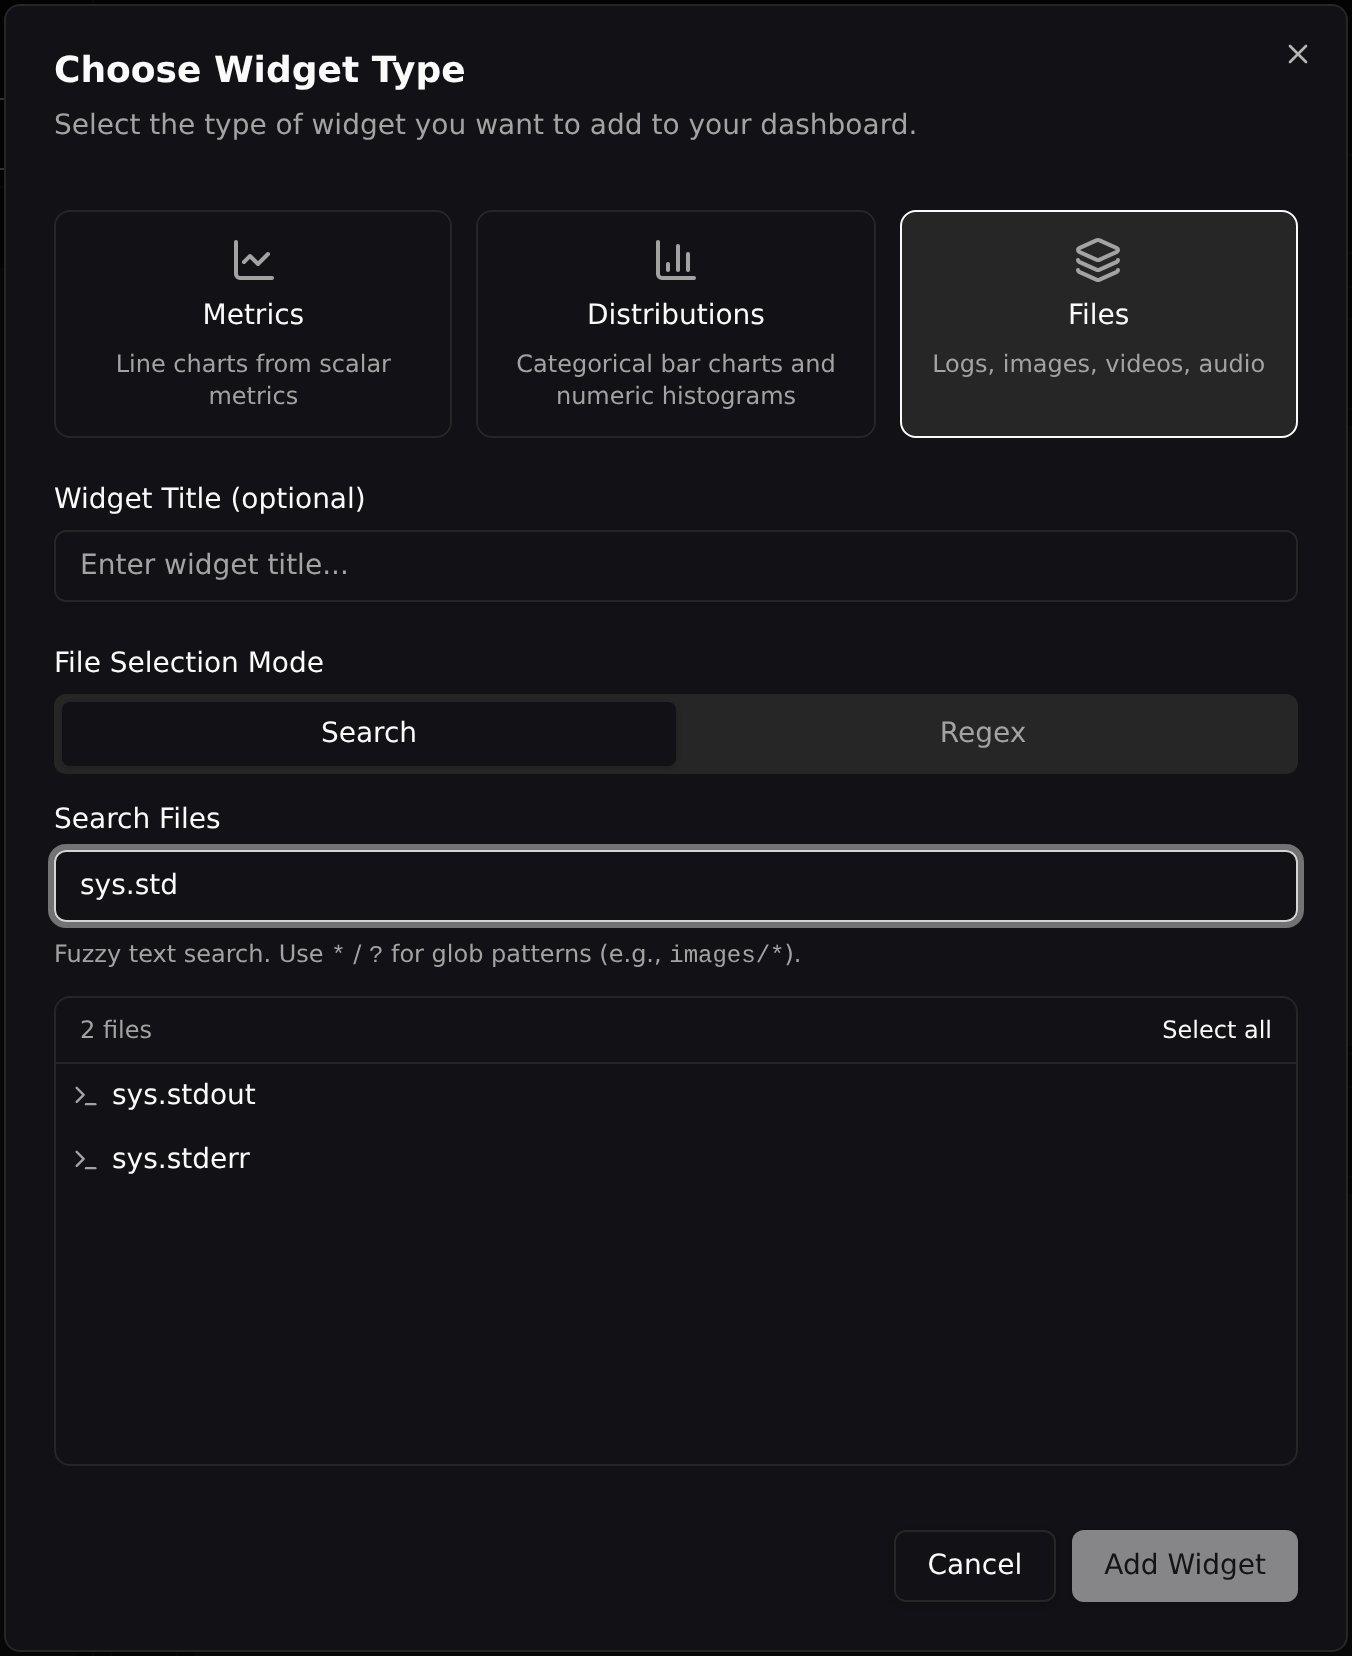
Open **Add Widget**, choose the **Files** tab, and search for a console log stream — `sys.stdout` or `sys.stderr`.
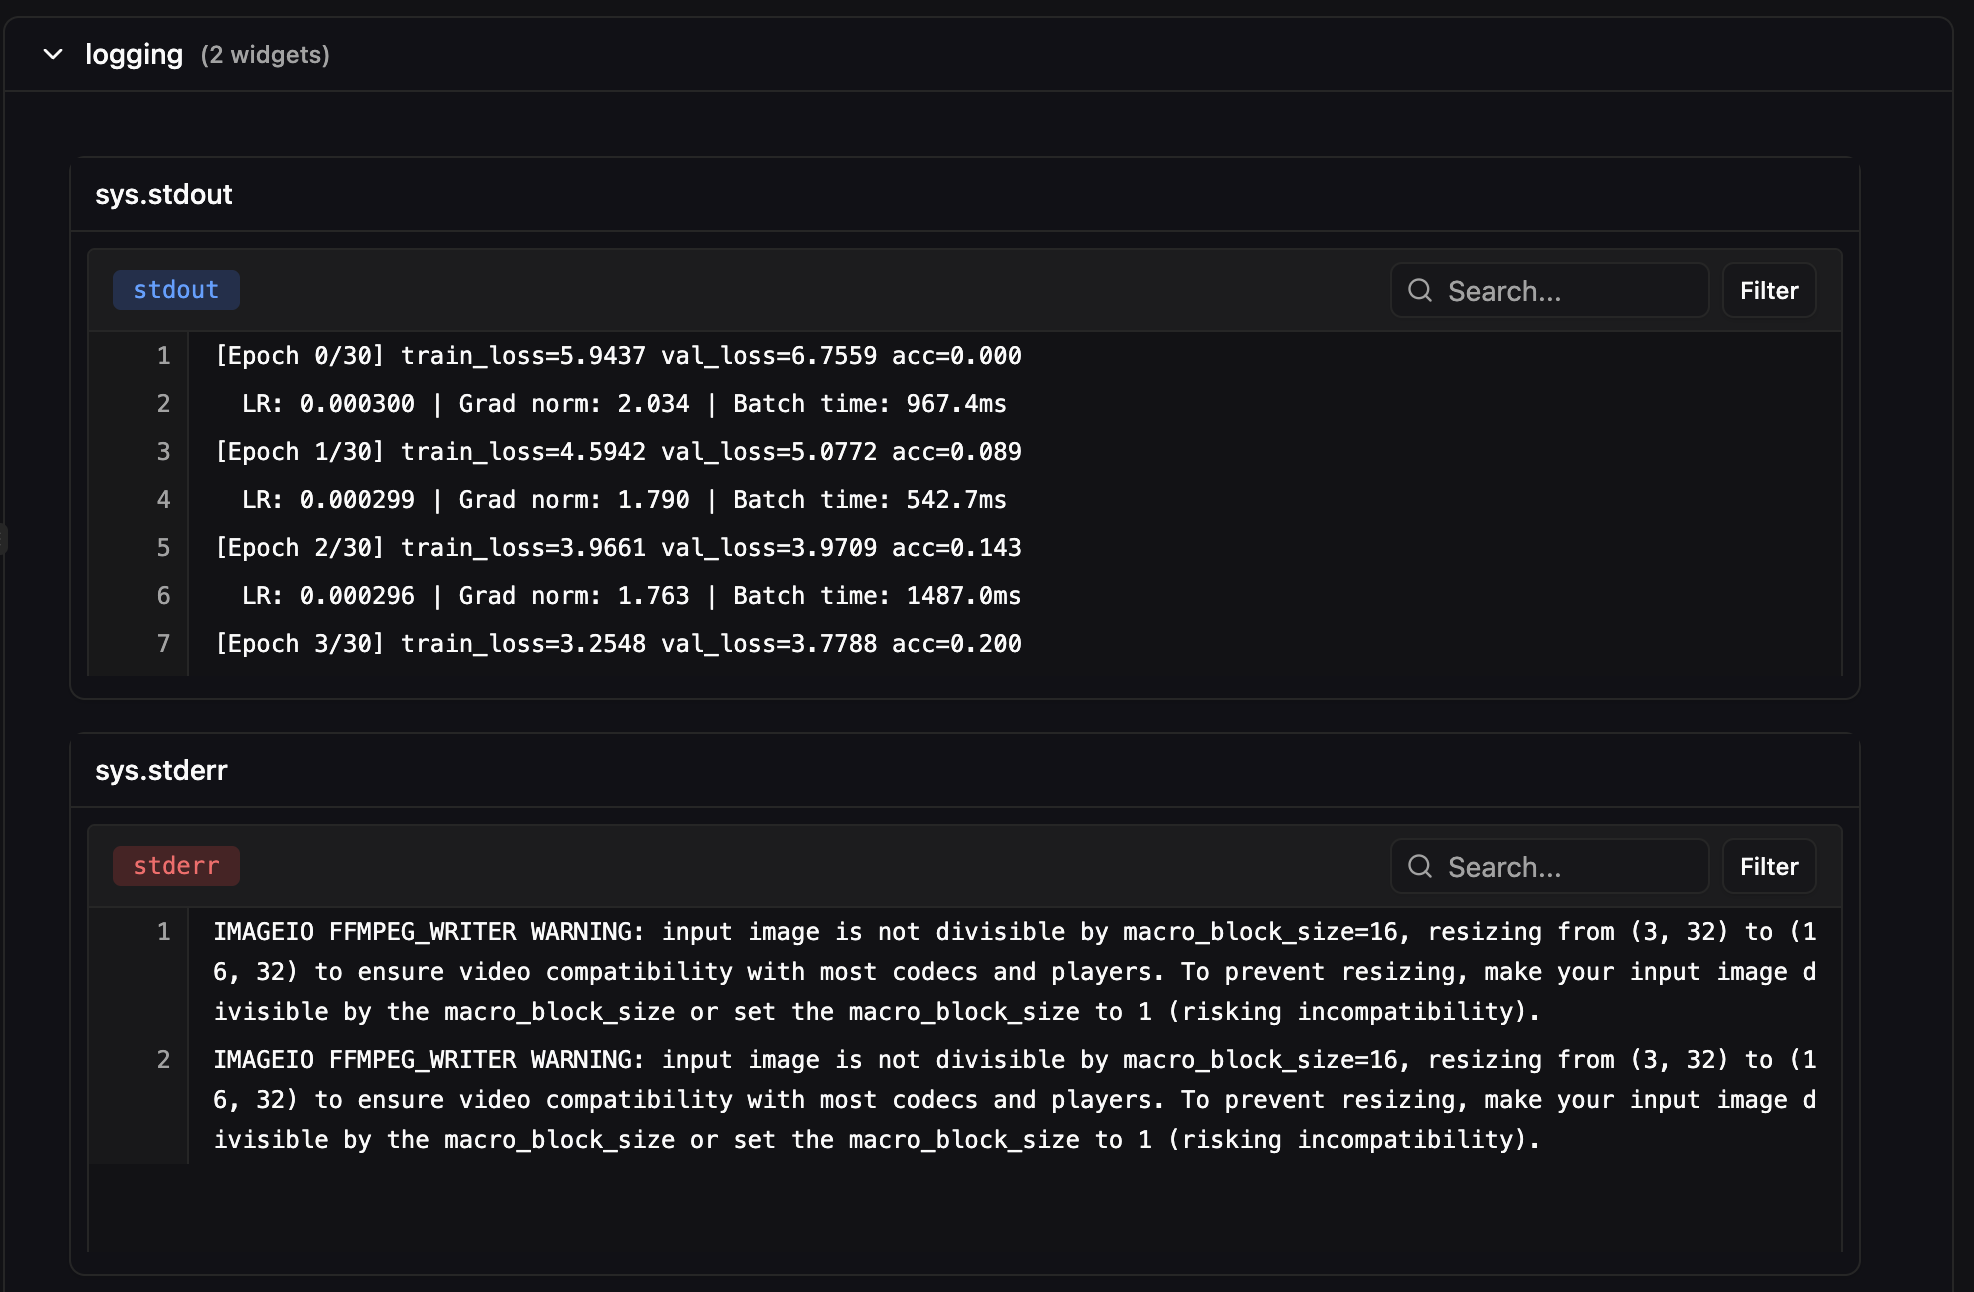
 The added widget renders your `stdout`/`stderr` inline on the dashboard:
 ## Search and filter
Console log widgets support the same tools as the full [Logs viewer](/pluto/logs):
* **Filter** — show only the log lines matching your query.
* **Navigate** — highlight matches and jump between them with next/previous while keeping the full log in view.
* **ANSI colors** — colored output (e.g. from `rich` or `colorama`) renders with its original terminal formatting.
Looking for the full-screen, per-run log viewer instead? See the dedicated [Logs](/pluto/logs) page.
## Search and filter
Console log widgets support the same tools as the full [Logs viewer](/pluto/logs):
* **Filter** — show only the log lines matching your query.
* **Navigate** — highlight matches and jump between them with next/previous while keeping the full log in view.
* **ANSI colors** — colored output (e.g. from `rich` or `colorama`) renders with its original terminal formatting.
Looking for the full-screen, per-run log viewer instead? See the dedicated [Logs](/pluto/logs) page.