> ## Documentation Index
> Fetch the complete documentation index at: https://docs.trainy.ai/llms.txt
> Use this file to discover all available pages before exploring further.
# Logs
> View logs from your run
Logs are collected from tracked experiments allowing you to scroll through your logs via the webUI.
## **Viewing Logs**
To view the logs of an experiment, you can click on the experiment in the list of experiments and then click on the "Logs" tab. You will see something like this:
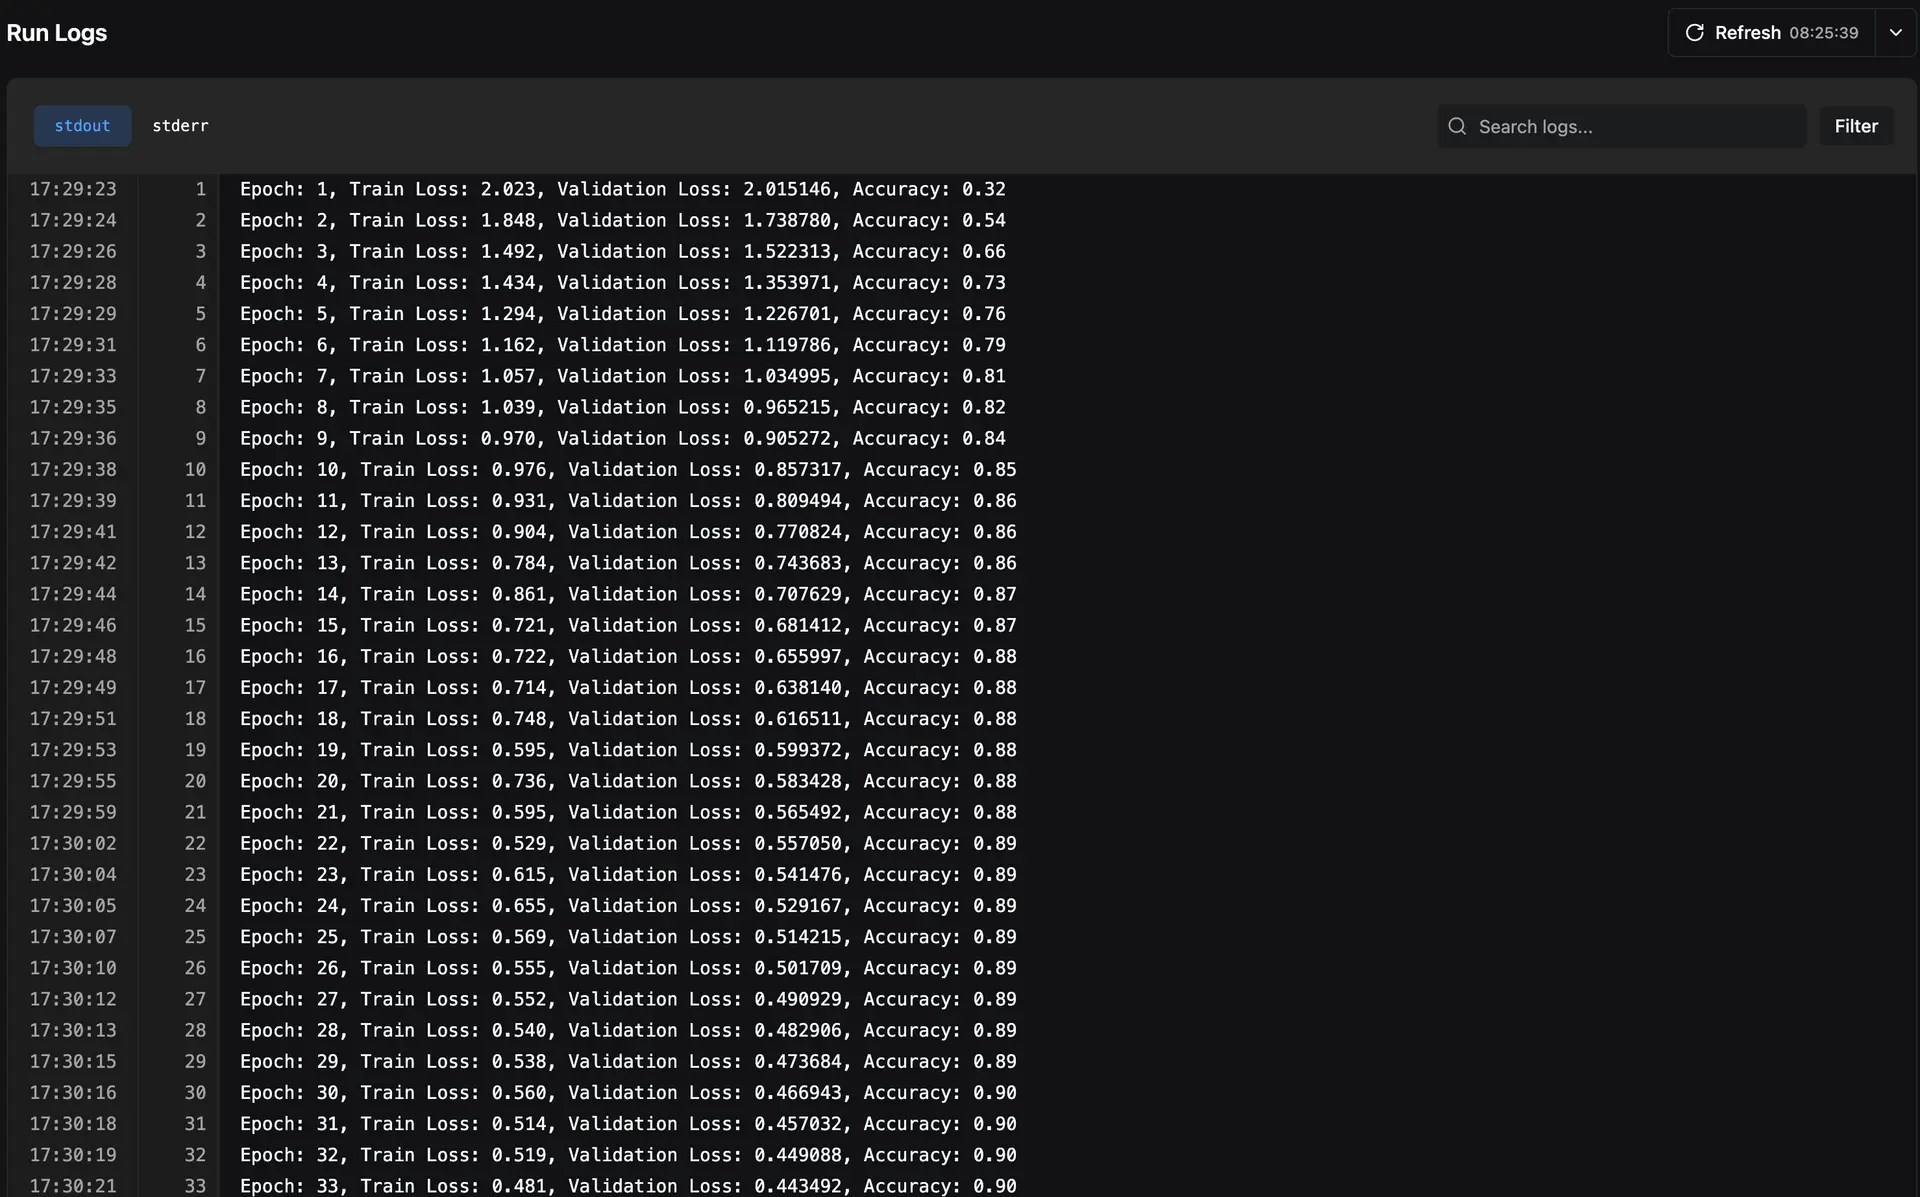 Both `stdout` and `stderr` of your experiments are saved, allowing you to filter out logs based on what you want to see.
## Search Modes
The logs viewer supports two search modes:
* **Filter** — Only shows log lines that match your search query, hiding everything else
* **Navigate** — Highlights matching lines and lets you jump between them with next/previous buttons while keeping the full log context visible
## ANSI Color Support
Logs retain ANSI color codes from your terminal output, so colored log messages (e.g., from libraries like `rich` or `colorama`) are rendered with their original formatting in the web UI.
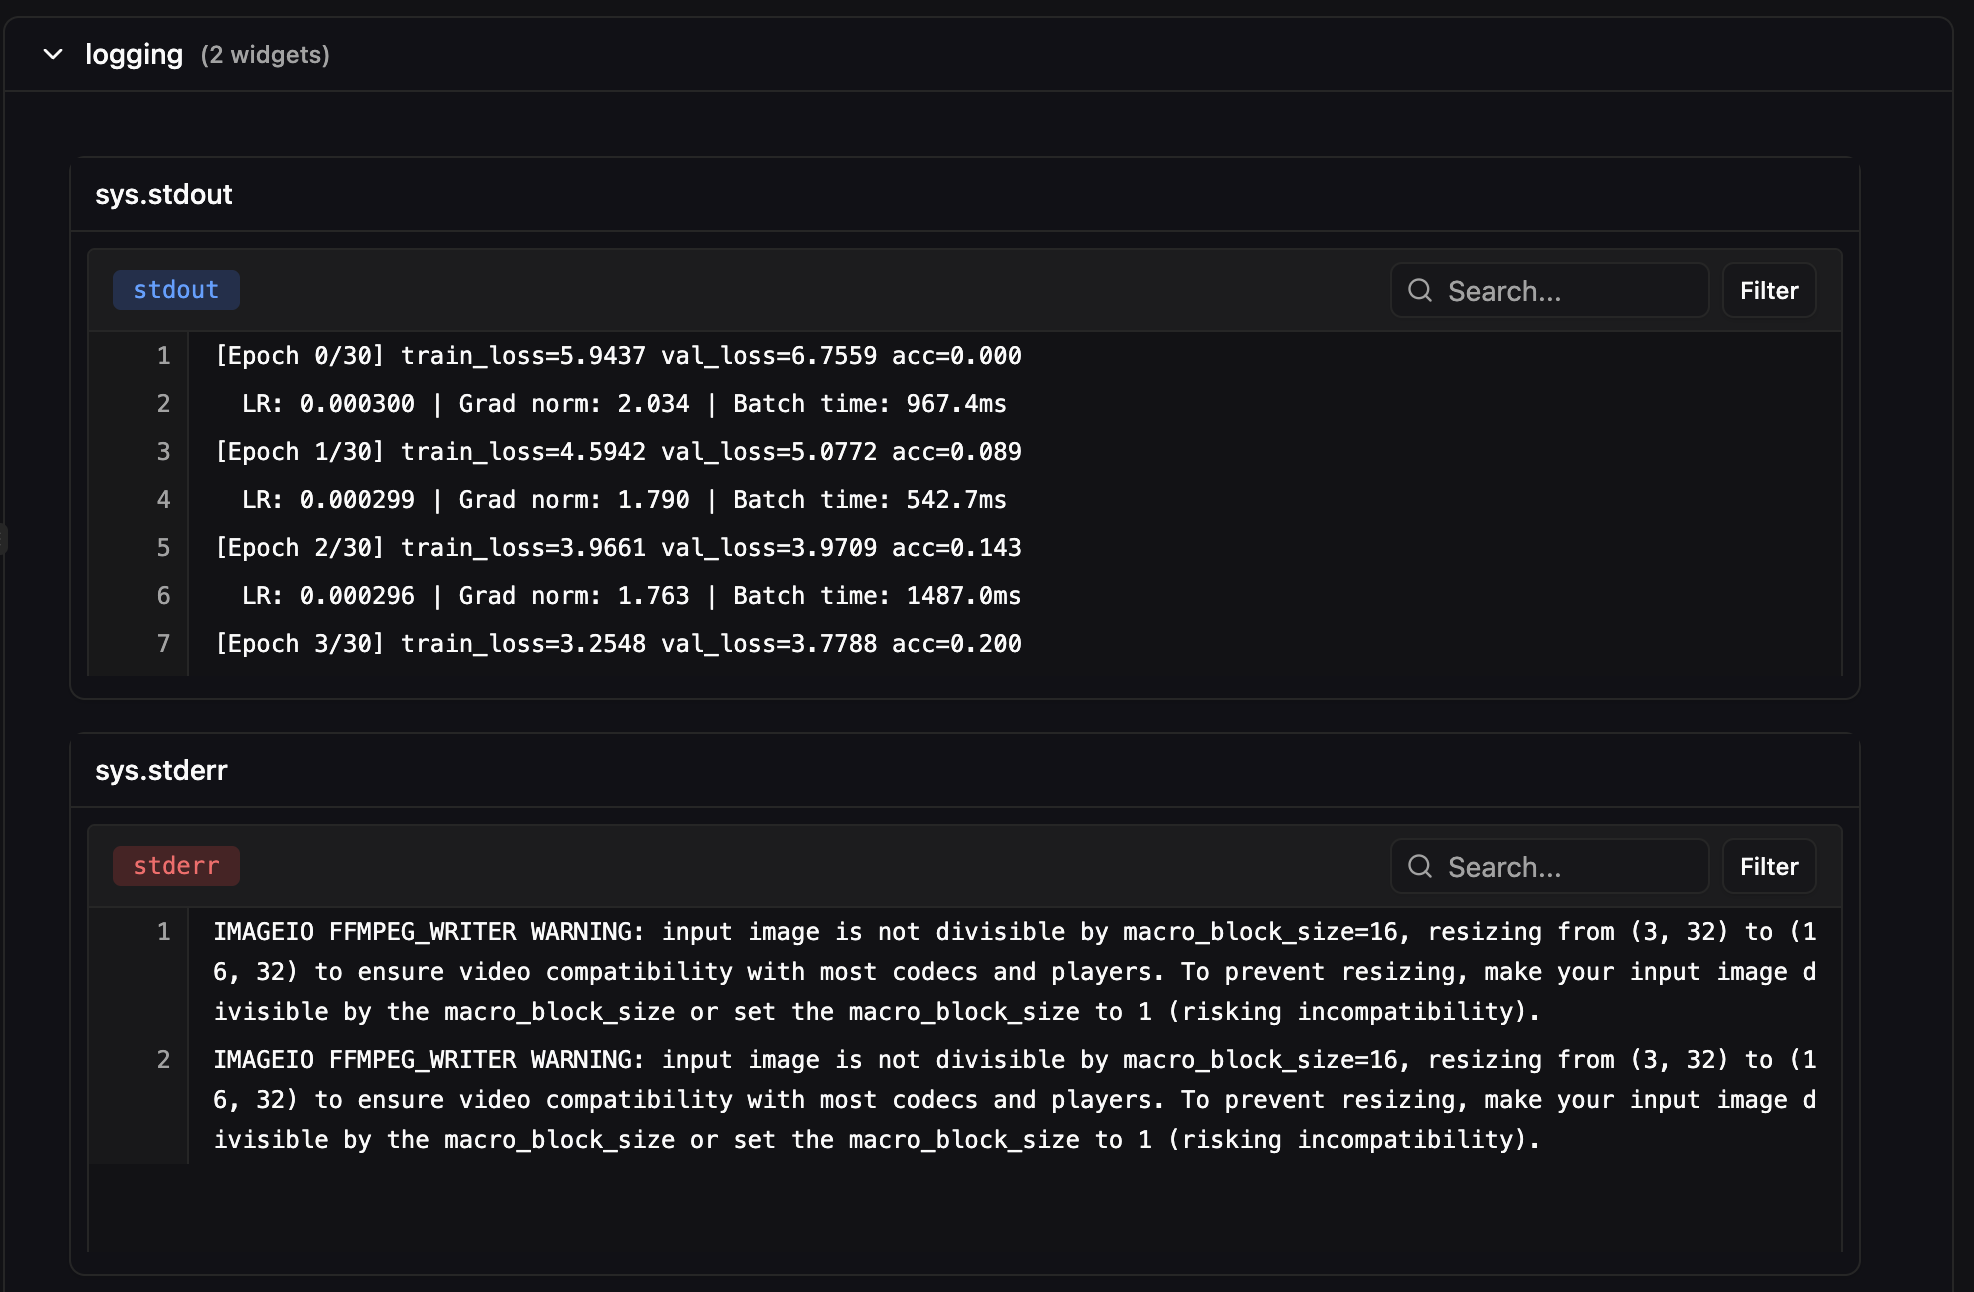
## Console Log Dashboard Widgets
In addition to the dedicated Logs tab, you can add **console log widgets** to [custom dashboards](/pluto/dashboards). This lets you view stdout/stderr alongside your metrics and visualizations in a single view. Console log widgets support the same search and filter functionality as the full logs viewer.
Both `stdout` and `stderr` of your experiments are saved, allowing you to filter out logs based on what you want to see.
## Search Modes
The logs viewer supports two search modes:
* **Filter** — Only shows log lines that match your search query, hiding everything else
* **Navigate** — Highlights matching lines and lets you jump between them with next/previous buttons while keeping the full log context visible
## ANSI Color Support
Logs retain ANSI color codes from your terminal output, so colored log messages (e.g., from libraries like `rich` or `colorama`) are rendered with their original formatting in the web UI.
## Console Log Dashboard Widgets
In addition to the dedicated Logs tab, you can add **console log widgets** to [custom dashboards](/pluto/dashboards). This lets you view stdout/stderr alongside your metrics and visualizations in a single view. Console log widgets support the same search and filter functionality as the full logs viewer.