> ## Documentation Index
> Fetch the complete documentation index at: https://docs.trainy.ai/llms.txt
> Use this file to discover all available pages before exploring further.
# Get Started with Grafana
> Trainy: Konduktor users can connect their telemetry to Grafana, featuring pre-configured dashboards optimized to display the metrics, events, and logs most relevant to your workloads.
To access your Grafana instance, contact Trainy support for access to the Grafana URL and login credentials.
## Grafana Explore
[Grafana Explore](https://grafana.com/docs/grafana/latest/explore/) enables users to do full PromQL and LogQL queries over logs and metrics and filter on metadata such as workload title or username.
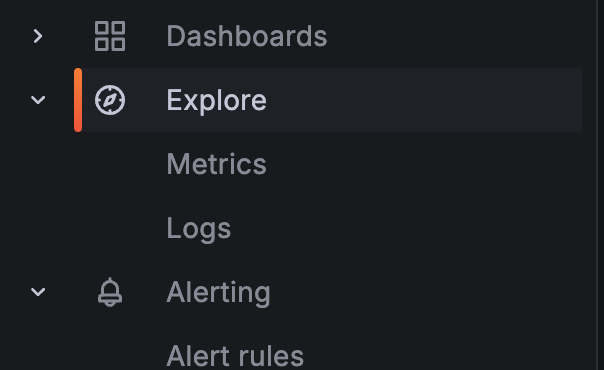 Trainy provides default dashboards curated views of logs and metrics, while the Explore tab empowers users to drill down into telemetry for in depth debugging.
## Available Dashboards
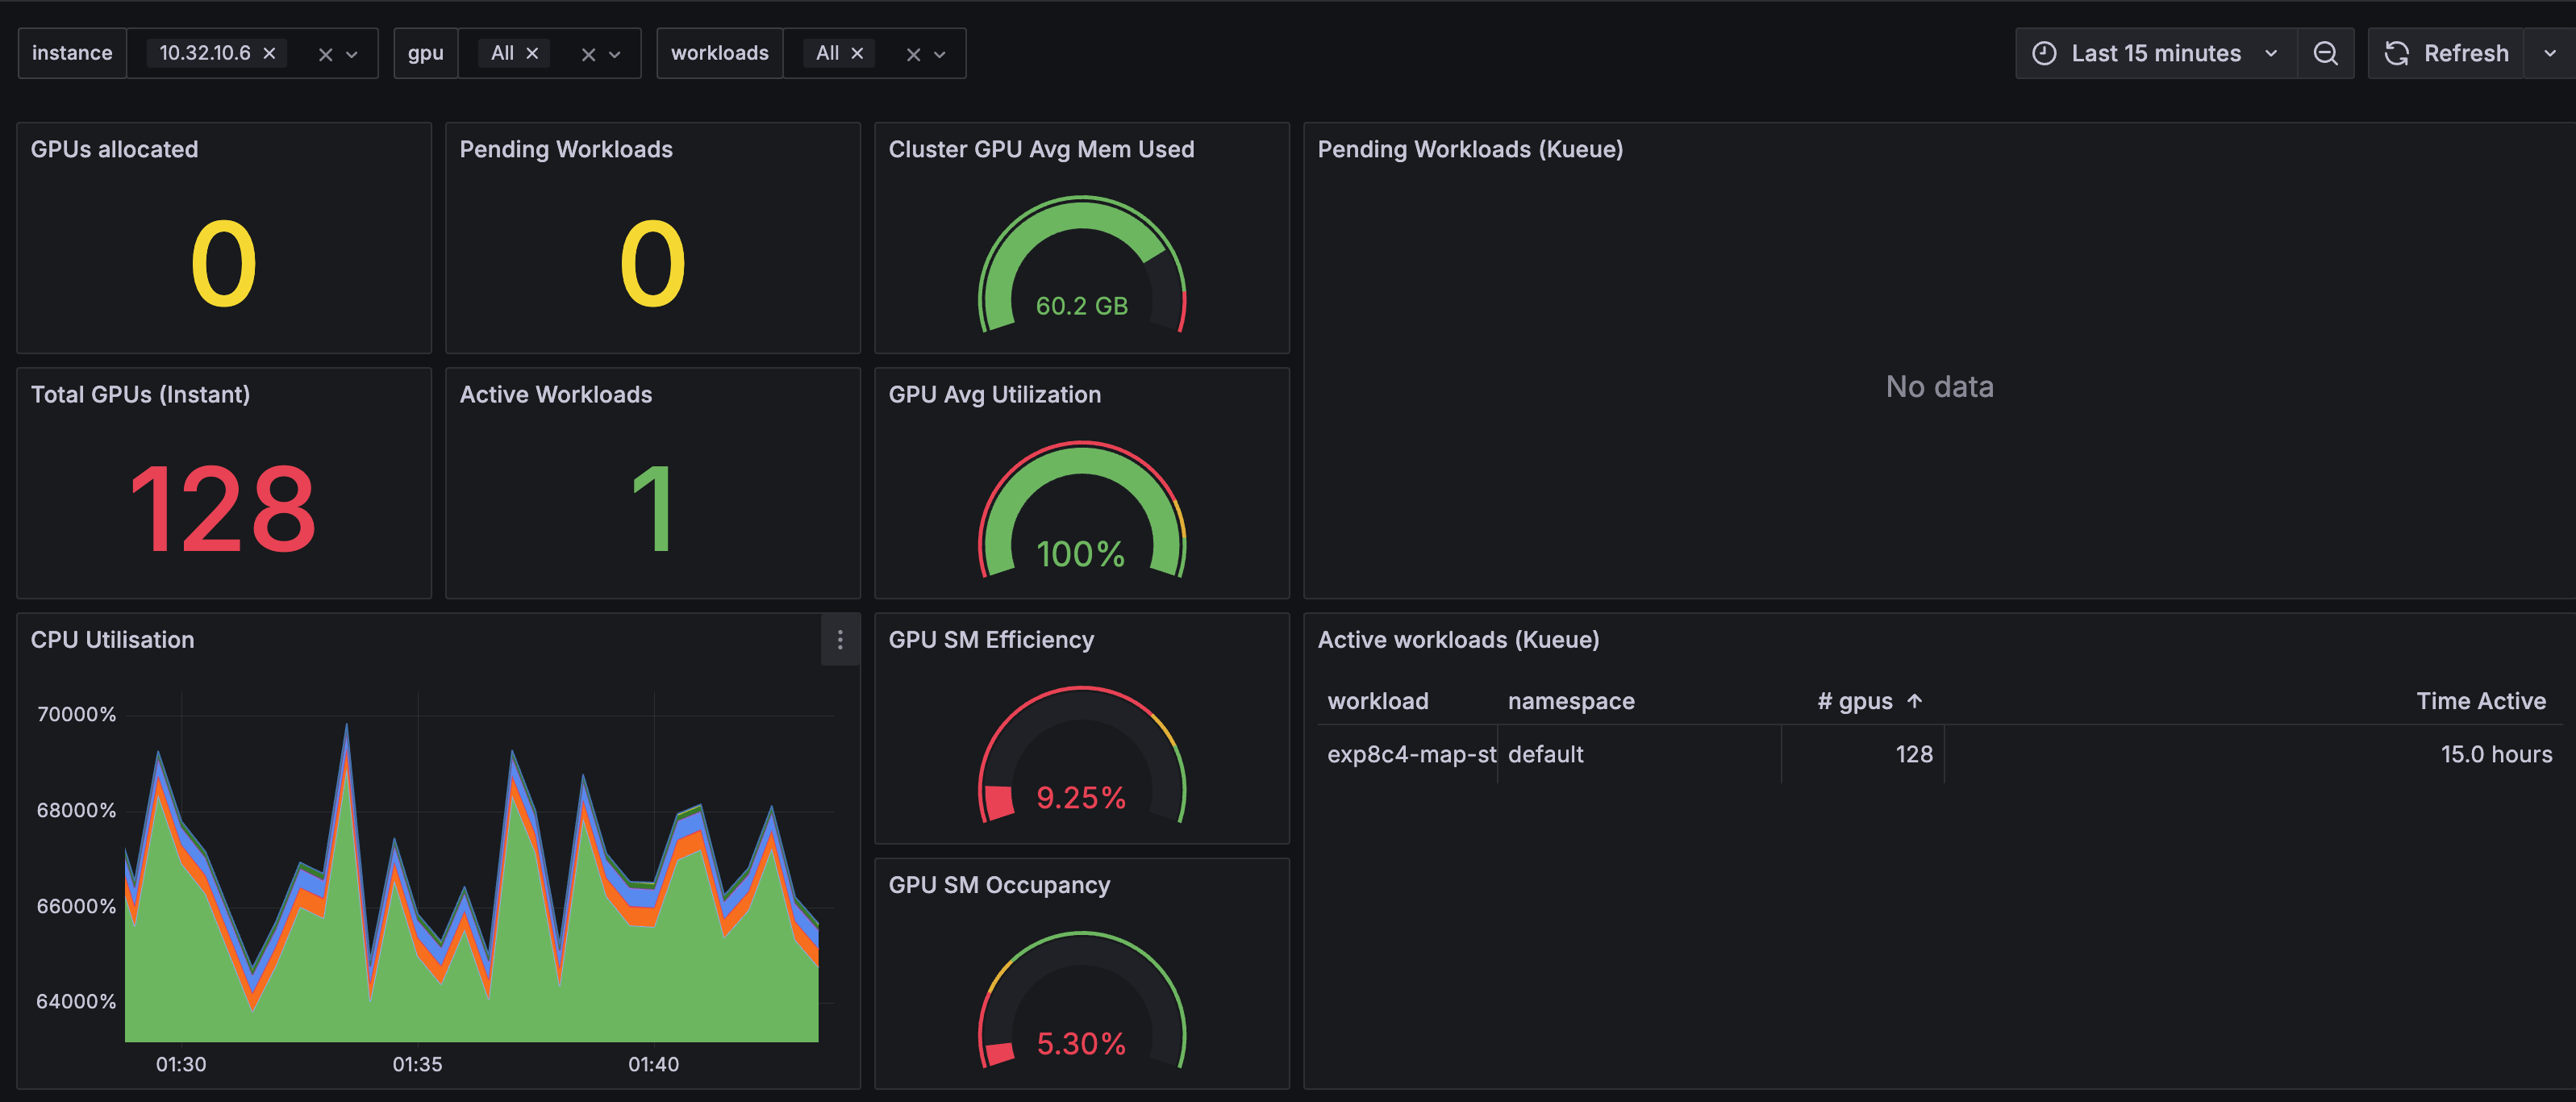
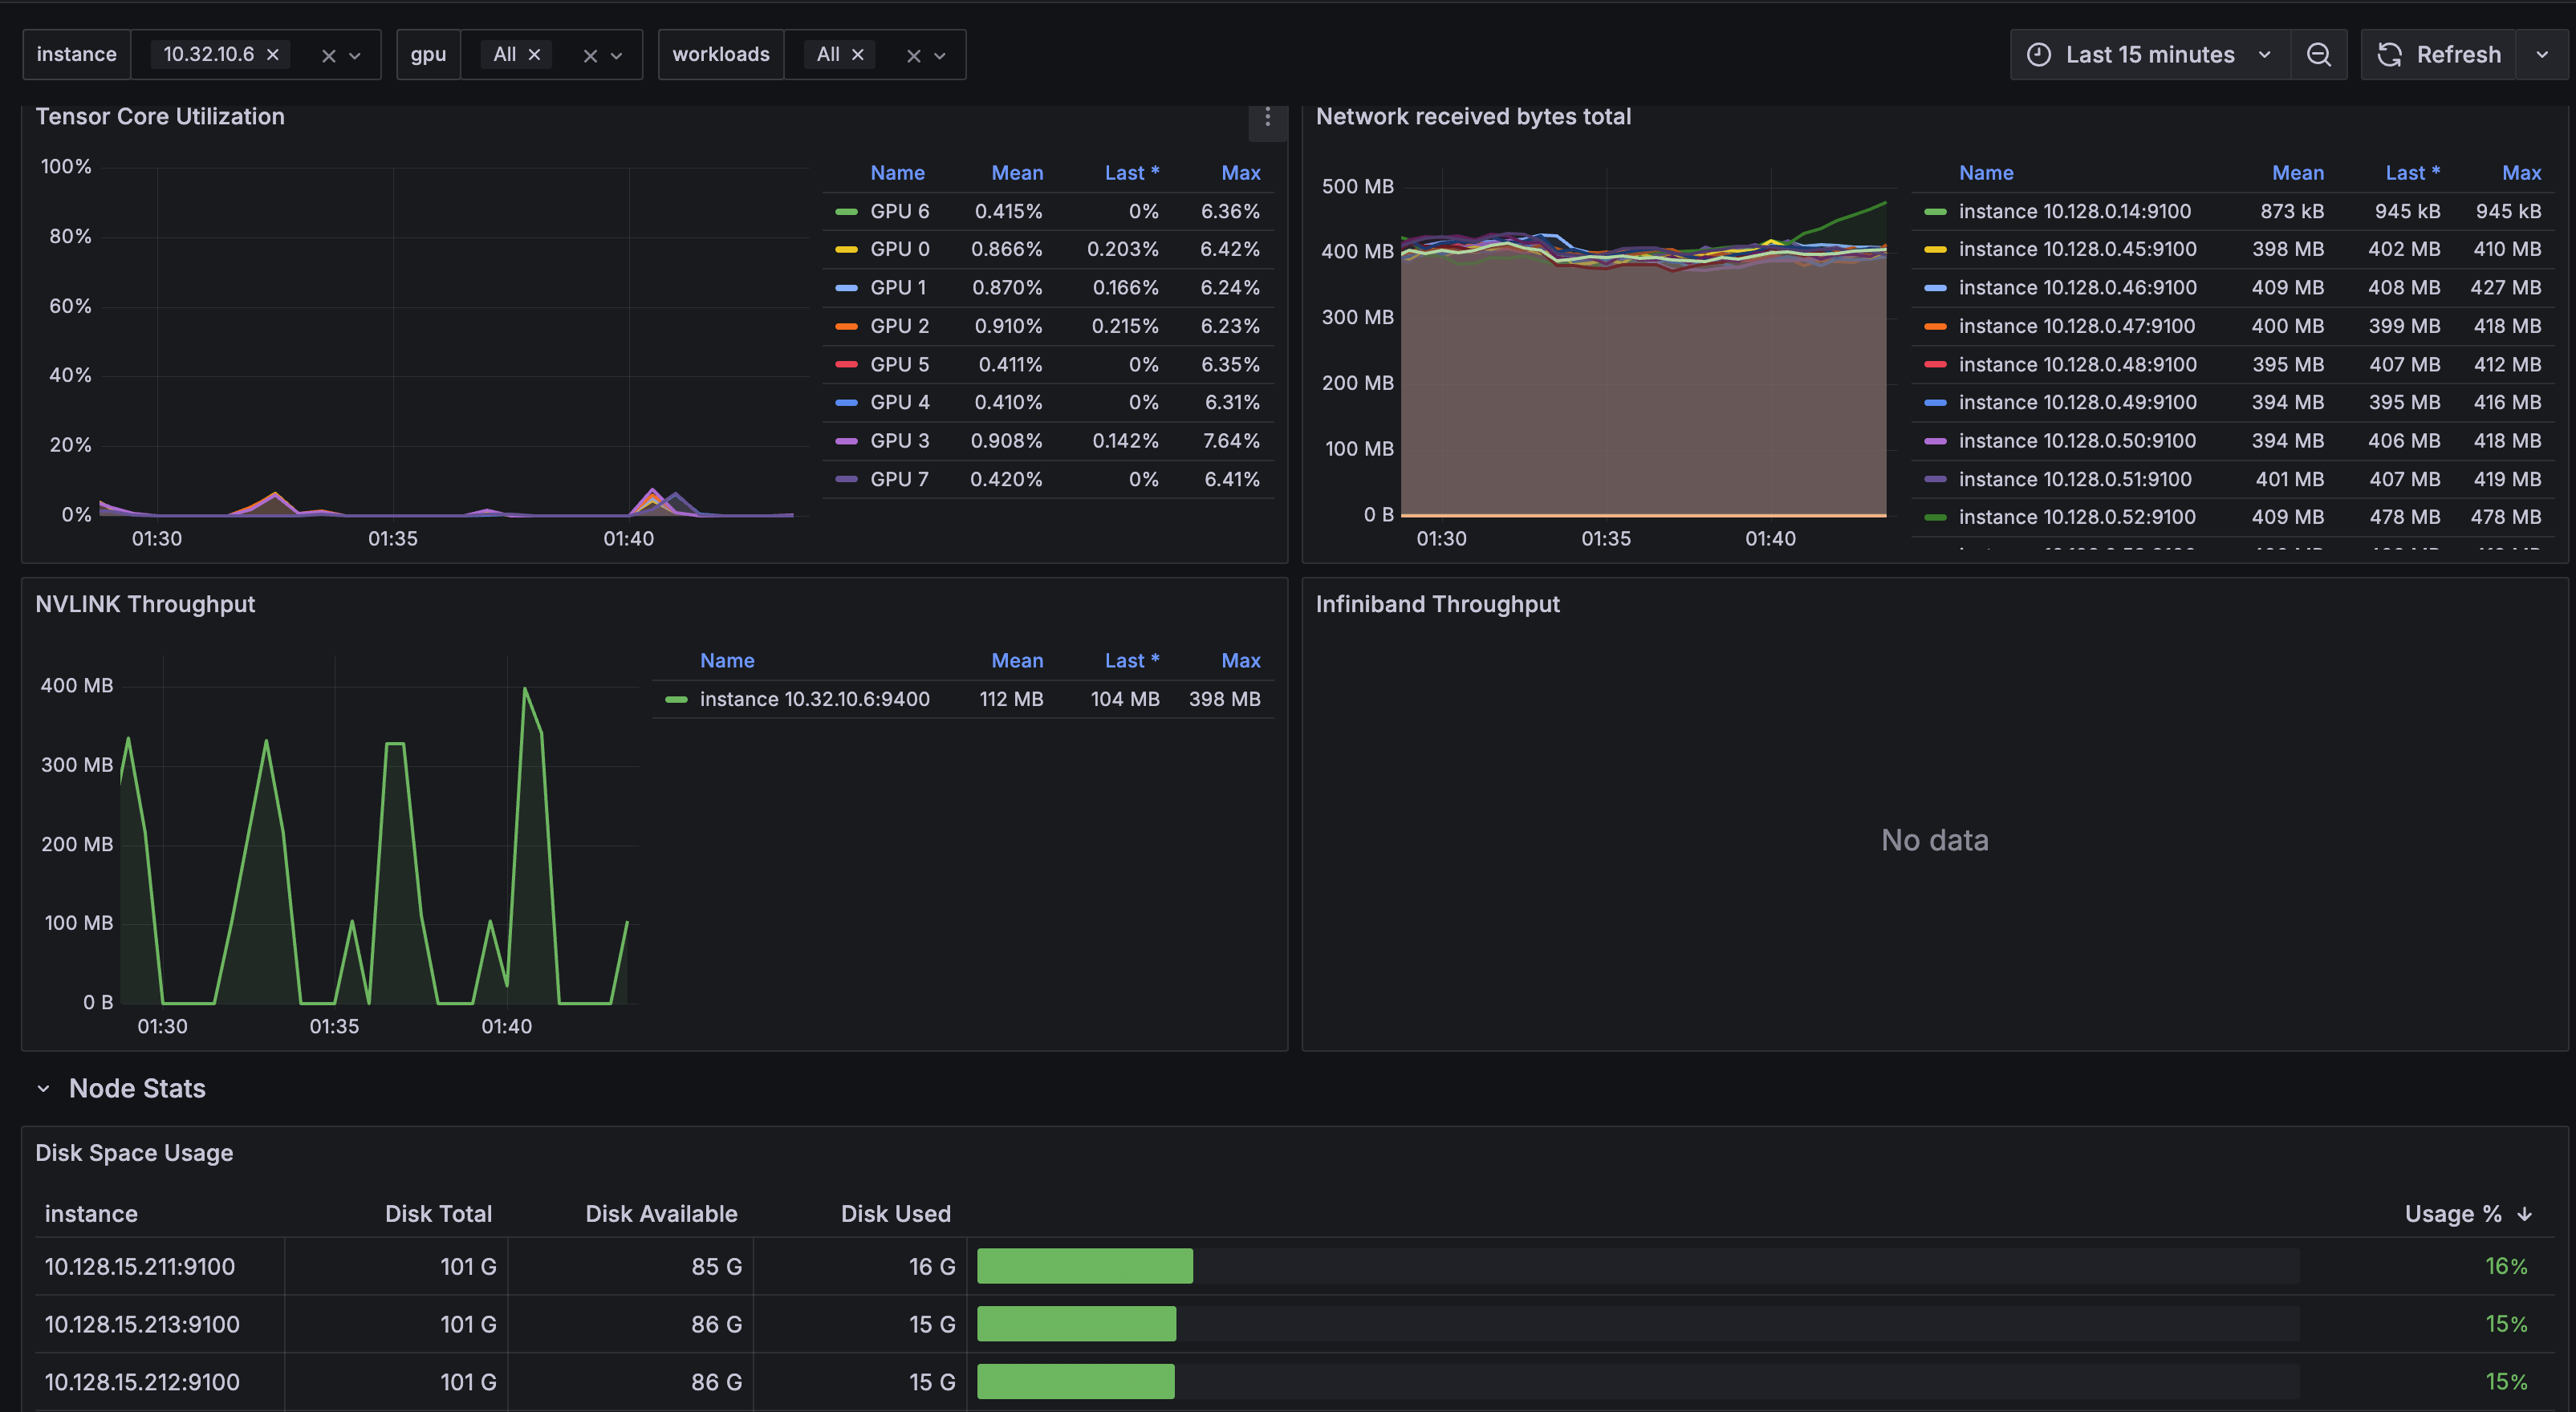
### Cluster Overview
The cluster overview dashboard shows overall system utilization such as GPU utilization, efficiency, Infiniband/RoCE throughput, and NVLINK throughput.
Trainy provides default dashboards curated views of logs and metrics, while the Explore tab empowers users to drill down into telemetry for in depth debugging.
## Available Dashboards
### Cluster Overview
The cluster overview dashboard shows overall system utilization such as GPU utilization, efficiency, Infiniband/RoCE throughput, and NVLINK throughput.
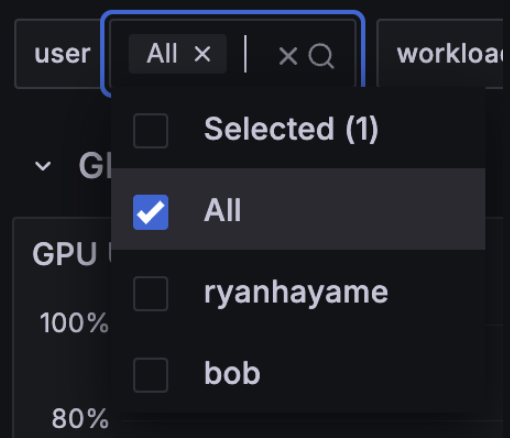
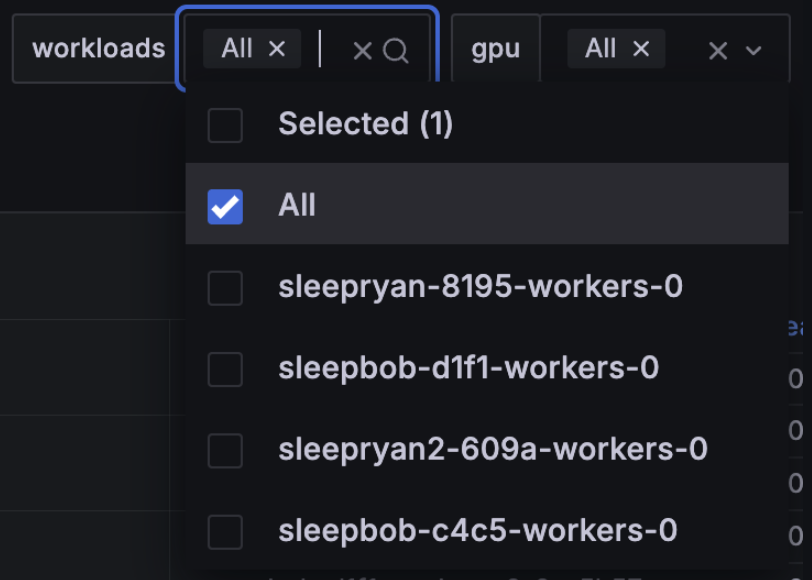
 ### Workload Inspector
The workload inspector ([video](https://www.youtube.com/watch?v=zg28er6Obpw)) allows for filtering of system metrics by workload and username.
### Workload Inspector
The workload inspector ([video](https://www.youtube.com/watch?v=zg28er6Obpw)) allows for filtering of system metrics by workload and username.